youth vote in presidential elections\nlook at the bar graph.\nwhat is the best conclusion that someone can…
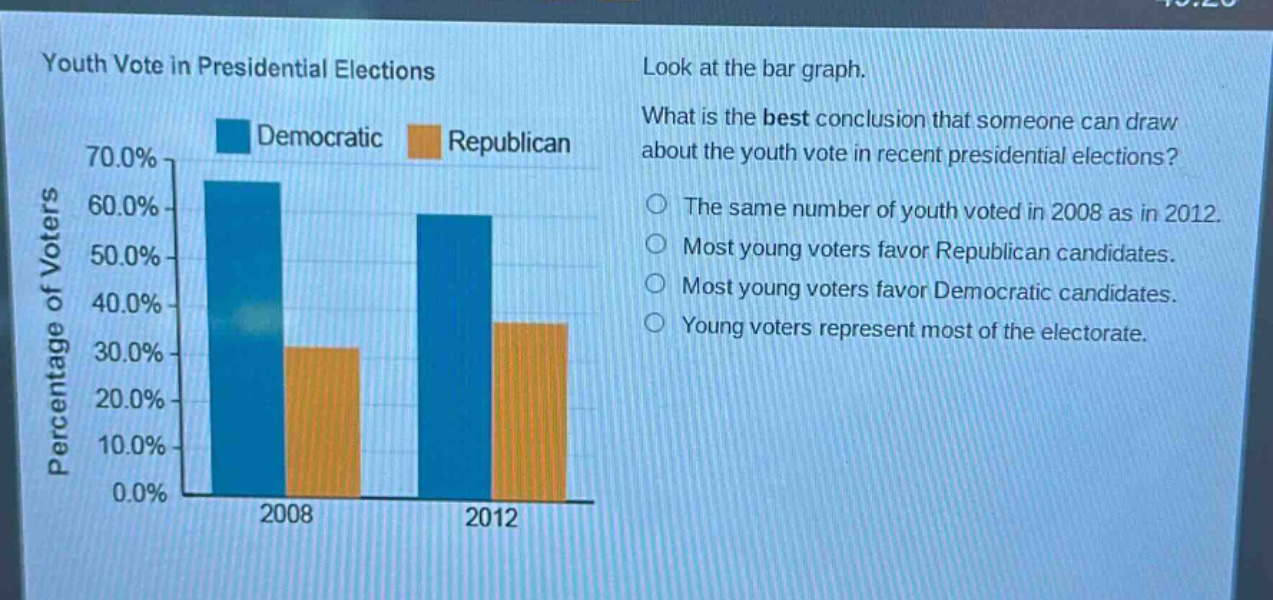
youth vote in presidential elections\nlook at the bar graph.\nwhat is the best conclusion that someone can draw about the youth vote in recent presidential elections?\nthe same number of youth voted in 2008 as in 2012.\nmost young voters favor republican candidates.\nmost young voters favor democratic candidates.\nyoung voters represent most of the electorate.
Answer
Brief Explanations:
The bar graph shows Democratic percentages (around 60% in 2008 and 55% in 2012) higher than Republican percentages (around 30% in both years), indicating Democratic favor. Other options are invalid: percentages don't show same number of voters, Republican favor is incorrect, and electorate majority isn't indicated.
Answer:
Most young voters favor Democratic candidates.