1, 1, 5, 5, 7, 8, 8, 10, 12\nwhich box plot correctly represents the data?
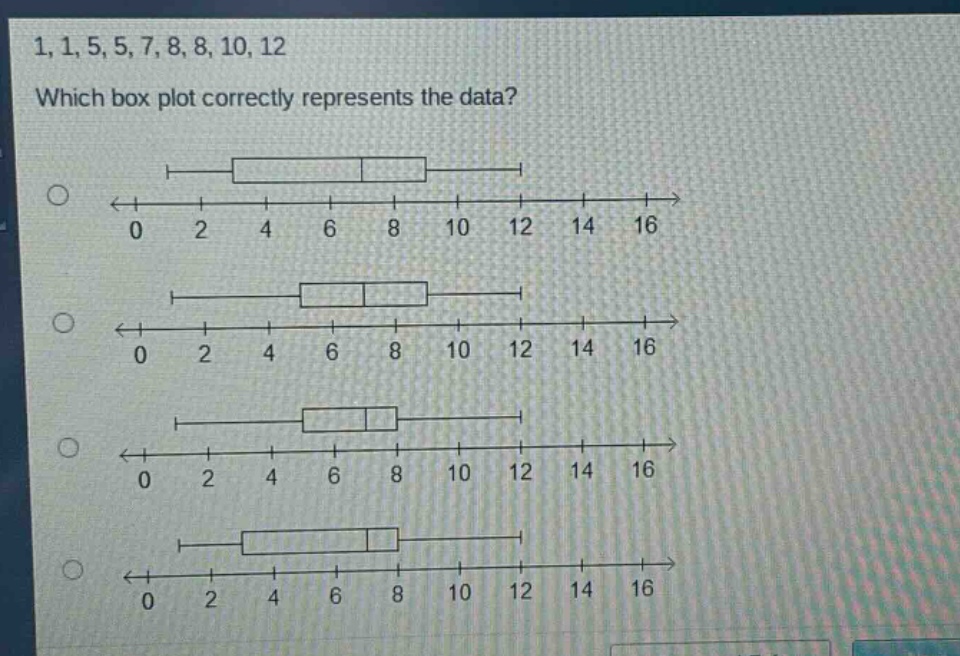
1, 1, 5, 5, 7, 8, 8, 10, 12\nwhich box plot correctly represents the data?
Answer
Answer:
To determine the correct box - plot, we need to find the five - number summary (minimum, first quartile $Q_1$, median, third quartile $Q_3$, maximum) of the data set $1,1,5,5,7,8,8,10,12$.
- Minimum value:
- The minimum value of the data set is $1$.
- Median ($Q_2$):
- Since there are $n = 9$ data points, the median is the $\left(\frac{n + 1}{2}\right)$-th value.
- $\frac{9+1}{2}=5$ - th value. So the median $Q_2=7$.
- First quartile ($Q_1$):
- The lower half of the data set is $1,1,5,5$. There are $n_1 = 4$ data points in the lower half.
- The median of the lower half (first quartile) is the average of the $\frac{4}{2}$-th and $\left(\frac{4}{2}+1\right)$-th ordered values.
- The $\frac{4}{2}=2$ - nd and $\left(\frac{4}{2}+1\right)=3$ - rd values are $1$ and $5$. So $Q_1=\frac{1 + 5}{2}=3$.
- Third quartile ($Q_3$):
- The upper half of the data set is $8,8,10,12$. There are $n_2 = 4$ data points in the upper half.
- The median of the upper half (third quartile) is the average of the $\frac{4}{2}$-th and $\left(\frac{4}{2}+1\right)$-th ordered values.
- The $\frac{4}{2}=2$ - nd and $\left(\frac{4}{2}+1\right)=3$ - rd values are $8$ and $10$. So $Q_3=\frac{8 + 10}{2}=9$.
- Maximum value:
- The maximum value of the data set is $12$.
The box - plot should have the minimum at $1$, $Q_1$ at $3$, the median at $7$, $Q_3$ at $9$, and the maximum at $12$.
We need to visually inspect the box - plots to find the one that has the left - most whisker at $1$, the left side of the box at $3$, the line inside the box at $7$, the right side of the box at $9$, and the right - most whisker at $12$.
(Without seeing the actual visual details of the box - plots to select from, we can't give a specific option. But the above is the process to find the correct box - plot.)
Explanation:
Step1: Find minimum
The smallest value is $1$.
Step2: Calculate median
For $n = 9$, median is 5 - th value, $7$.
Step3: Find first quartile
Median of lower half ($1,1,5,5$) is $\frac{1 + 5}{2}=3$.
Step4: Find third quartile
Median of upper half ($8,8,10,12$) is $\frac{8+10}{2}=9$.
Step5: Find maximum
The largest value is $12$.