a 10 - item statistics quiz was given to 30 students. the table below gives the scores received along with…
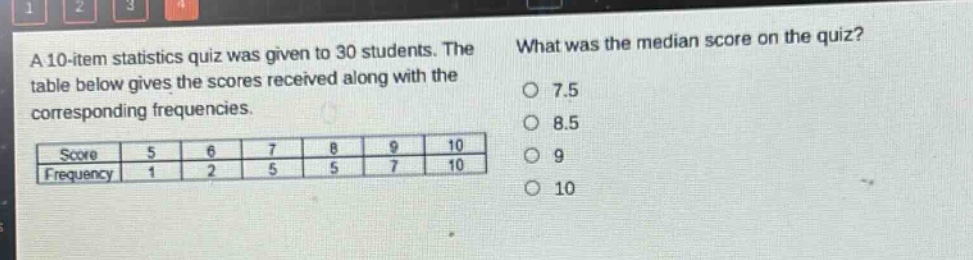
a 10 - item statistics quiz was given to 30 students. the table below gives the scores received along with the corresponding frequencies.\n| score | 5 | 6 | 7 | 8 | 9 | 10 |\n| frequency | 1 | 2 | 5 | 5 | 7 | 10 |\nwhat was the median score on the quiz?\n7.5\n8.5\n9\n10
Answer
Answer:
9
Explanation:
Step1: Calculate total frequency
$1 + 2+5 + 5+7 + 10=30$
Step2: Determine position of median
Since $n = 30$ (even), median position is $\frac{n}{2}=15$ and $\frac{n}{2}+ 1 = 16$.
Step3: Cumulative - frequency calculation
For score 5, cumulative - frequency $CF_1=1$; for score 6, $CF_2=1 + 2=3$; for score 7, $CF_3=3 + 5=8$; for score 8, $CF_4=8 + 5=13$; for score 9, $CF_5=13 + 7=20$.
Step4: Find median
The 15th and 16th ordered - data values fall within the score of 9. So the median is 9.