2, 3, 5, 5, 6, 7, 8, 8, 11\n\nwhich box plot correctly summarizes the data?\n\nchoose 1 answer:
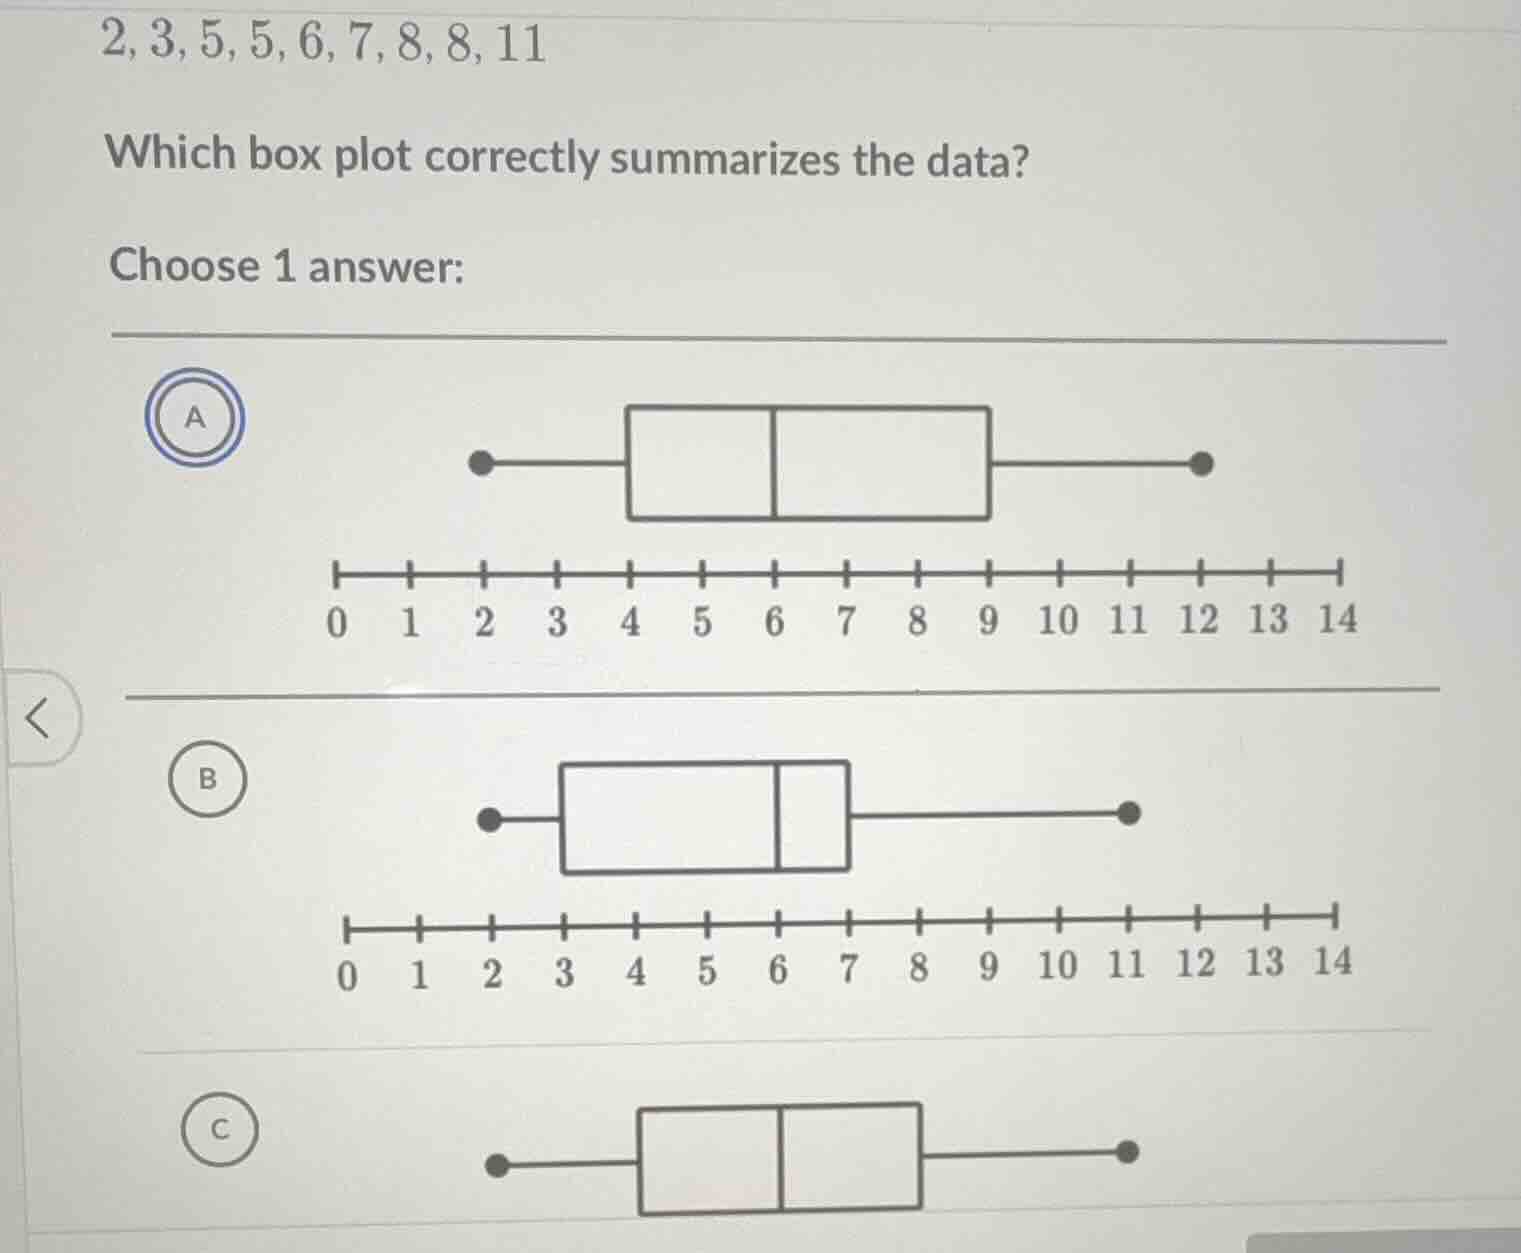
2, 3, 5, 5, 6, 7, 8, 8, 11\n\nwhich box plot correctly summarizes the data?\n\nchoose 1 answer:
Answer
Explanation:
Step1: Identify the five-number summary
The data set is: $2, 3, 5, 5, 6, 7, 8, 8, 11$. Minimum: $2$ Maximum: $11$
Step2: Calculate the median ($Q_{2}$)
The median is the middle value of $9$ numbers. $$Q_{2} = 6$$
Step3: Calculate the first quartile ($Q_{1}$)
$Q_{1}$ is the median of the lower half: $2, 3, 5, 5$. $$Q_{1} = \frac{3 + 5}{2} = 4$$
Step4: Calculate the third quartile ($Q_{3}$)
$Q_{3}$ is the median of the upper half: $7, 8, 8, 11$. $$Q_{3} = \frac{8 + 8}{2} = 8$$
Step5: Compare summary to the box plots
Plot A: Min=$2$, $Q_{1}=4$, Med=$6$, $Q_{3}=9$, Max=$12$ (Incorrect) Plot B: Min=$2$, $Q_{1}=3$, Med=$6$, $Q_{3}=7$, Max=$11$ (Incorrect) Plot C: Min=$2$, $Q_{1}=4$, Med=$6$, $Q_{3}=8$, Max=$11$ (Correct)
Answer:
C. Plot C