11. in the figure, the shaded region represents $47.5\\%$ of the area under a normal curve. what are the…
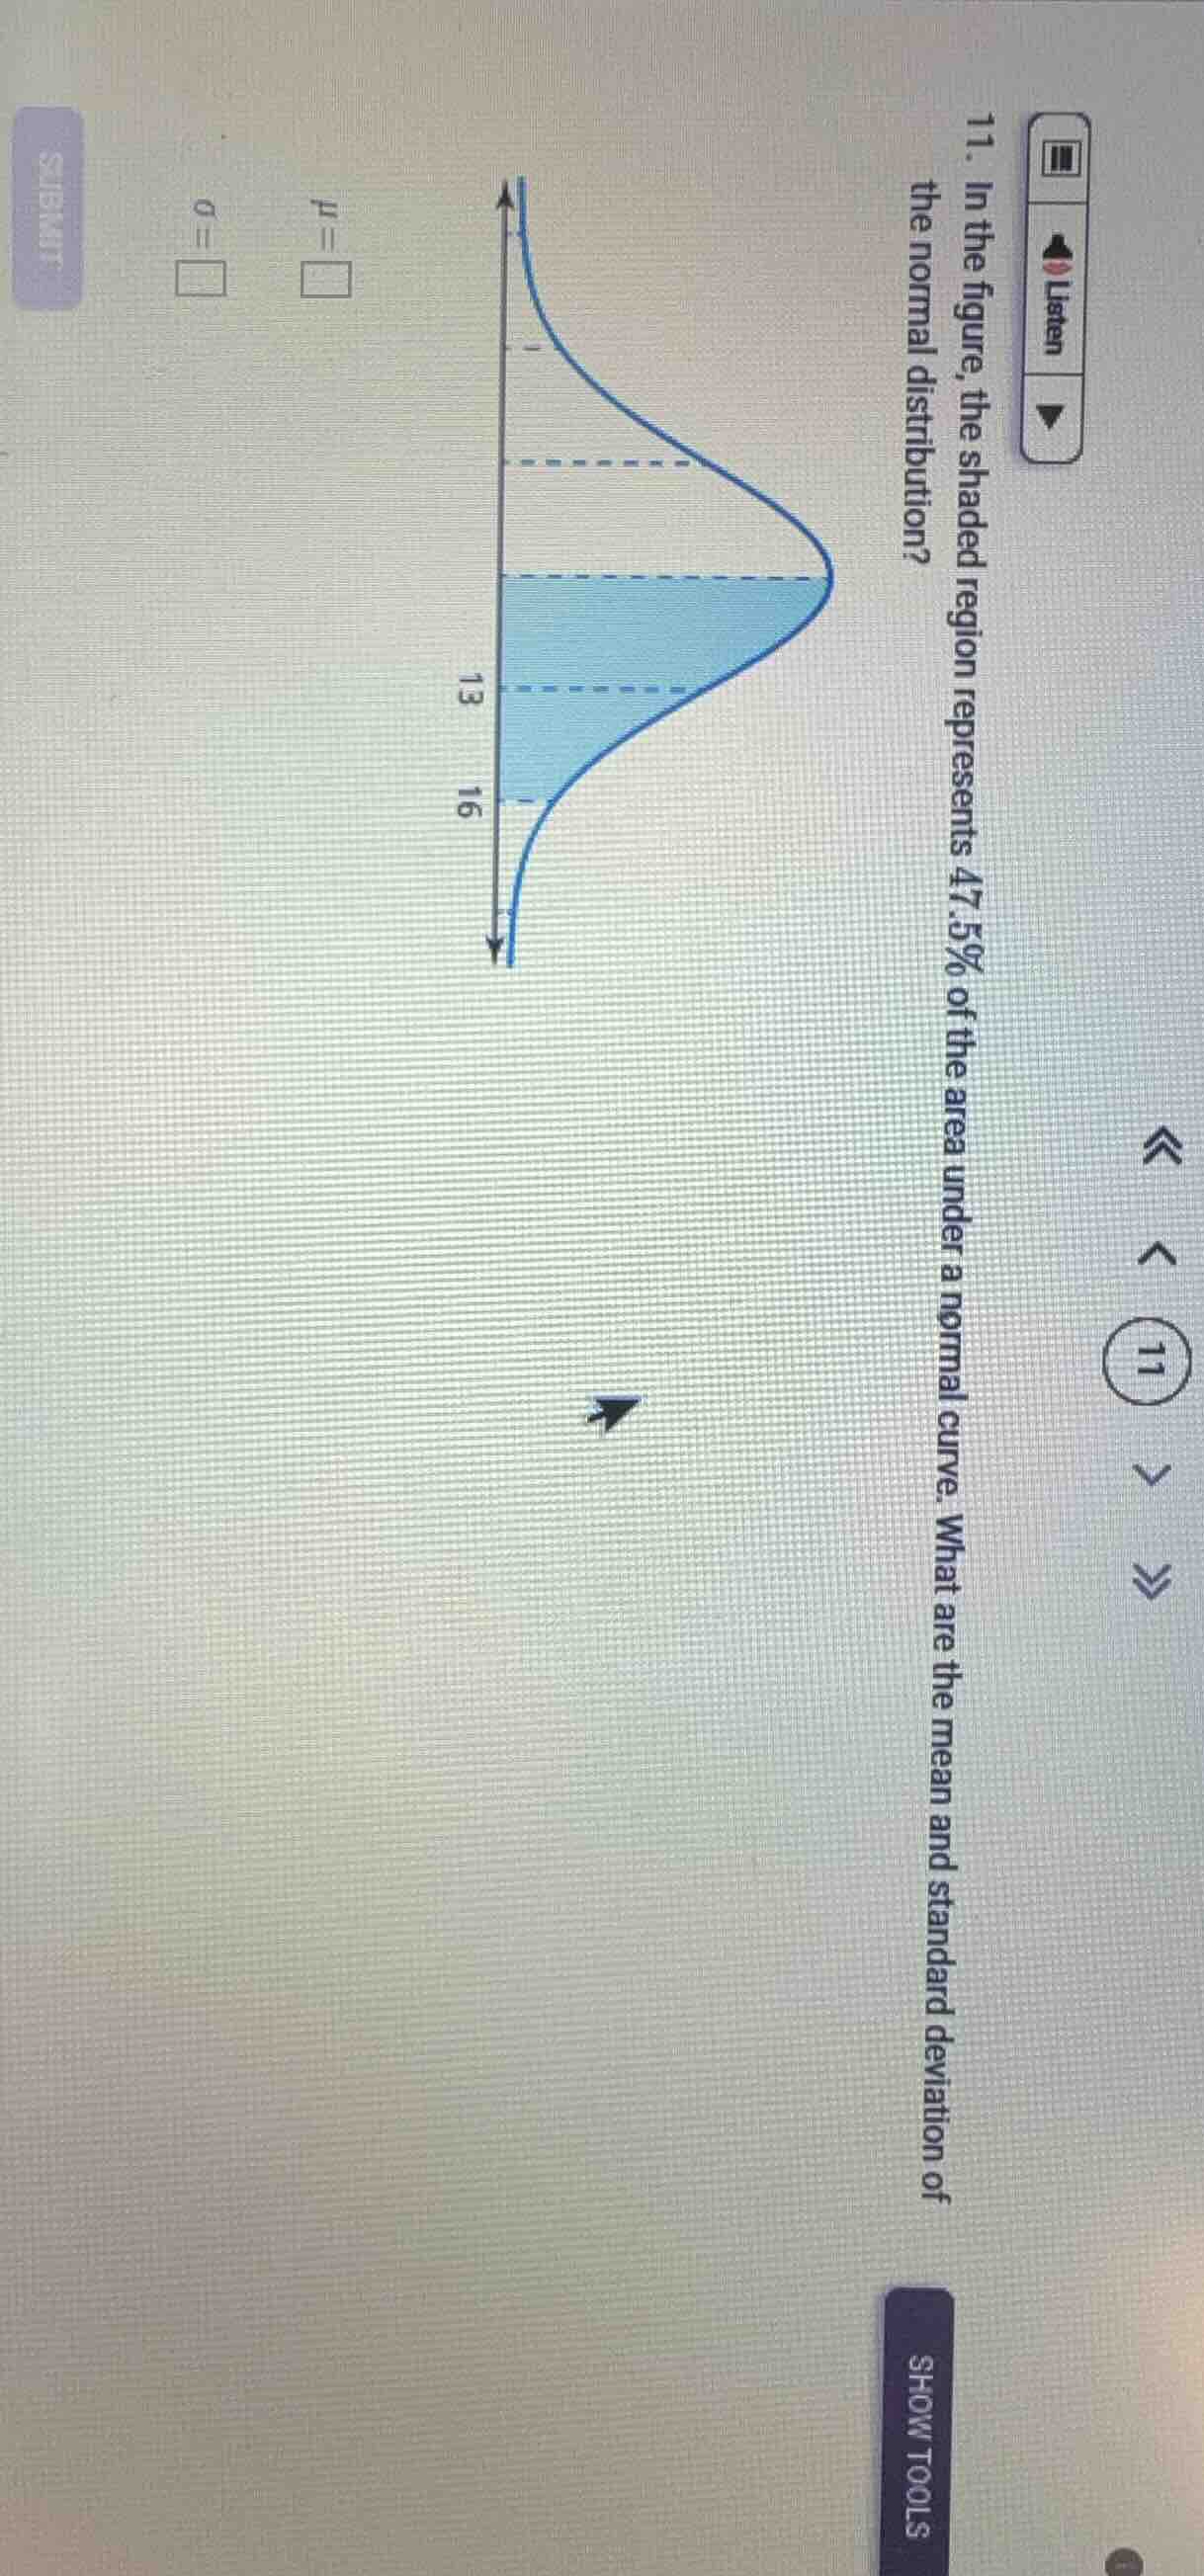
11. in the figure, the shaded region represents $47.5\\%$ of the area under a normal curve. what are the mean and standard deviation of the normal distribution?\n\n$\\mu = \\square$\n$\\sigma = \\square$
Answer
Explanation:
Step1: Identify the mean from the graph
The mean $\mu$ is the center of the normal distribution. $$\mu = 13$$
Step2: Relate shaded area to standard deviations
The area between $\mu$ and $\mu + 2\sigma$ is $47.5%$. $$P(\mu \leq X \leq \mu + 2\sigma) = 0.475$$
Step3: Identify the value at two standard deviations
The graph shows the boundary of the shaded area is $16$. $$\mu + 2\sigma = 16$$
Step4: Solve for the standard deviation
Substitute $\mu = 13$ into the equation and solve for $\sigma$. $$13 + 2\sigma = 16 \implies 2\sigma = 3 \implies \sigma = 1.5$$
Answer:
$\mu = 13$ $\sigma = 1.5$