11) \n| x | y |\n|---|---|\n| 1 | 0.51 |\n| 5 | 0.33 |\n| 5 | 0.65 |\n| 30 | 0.52 |\n\n| x | y…
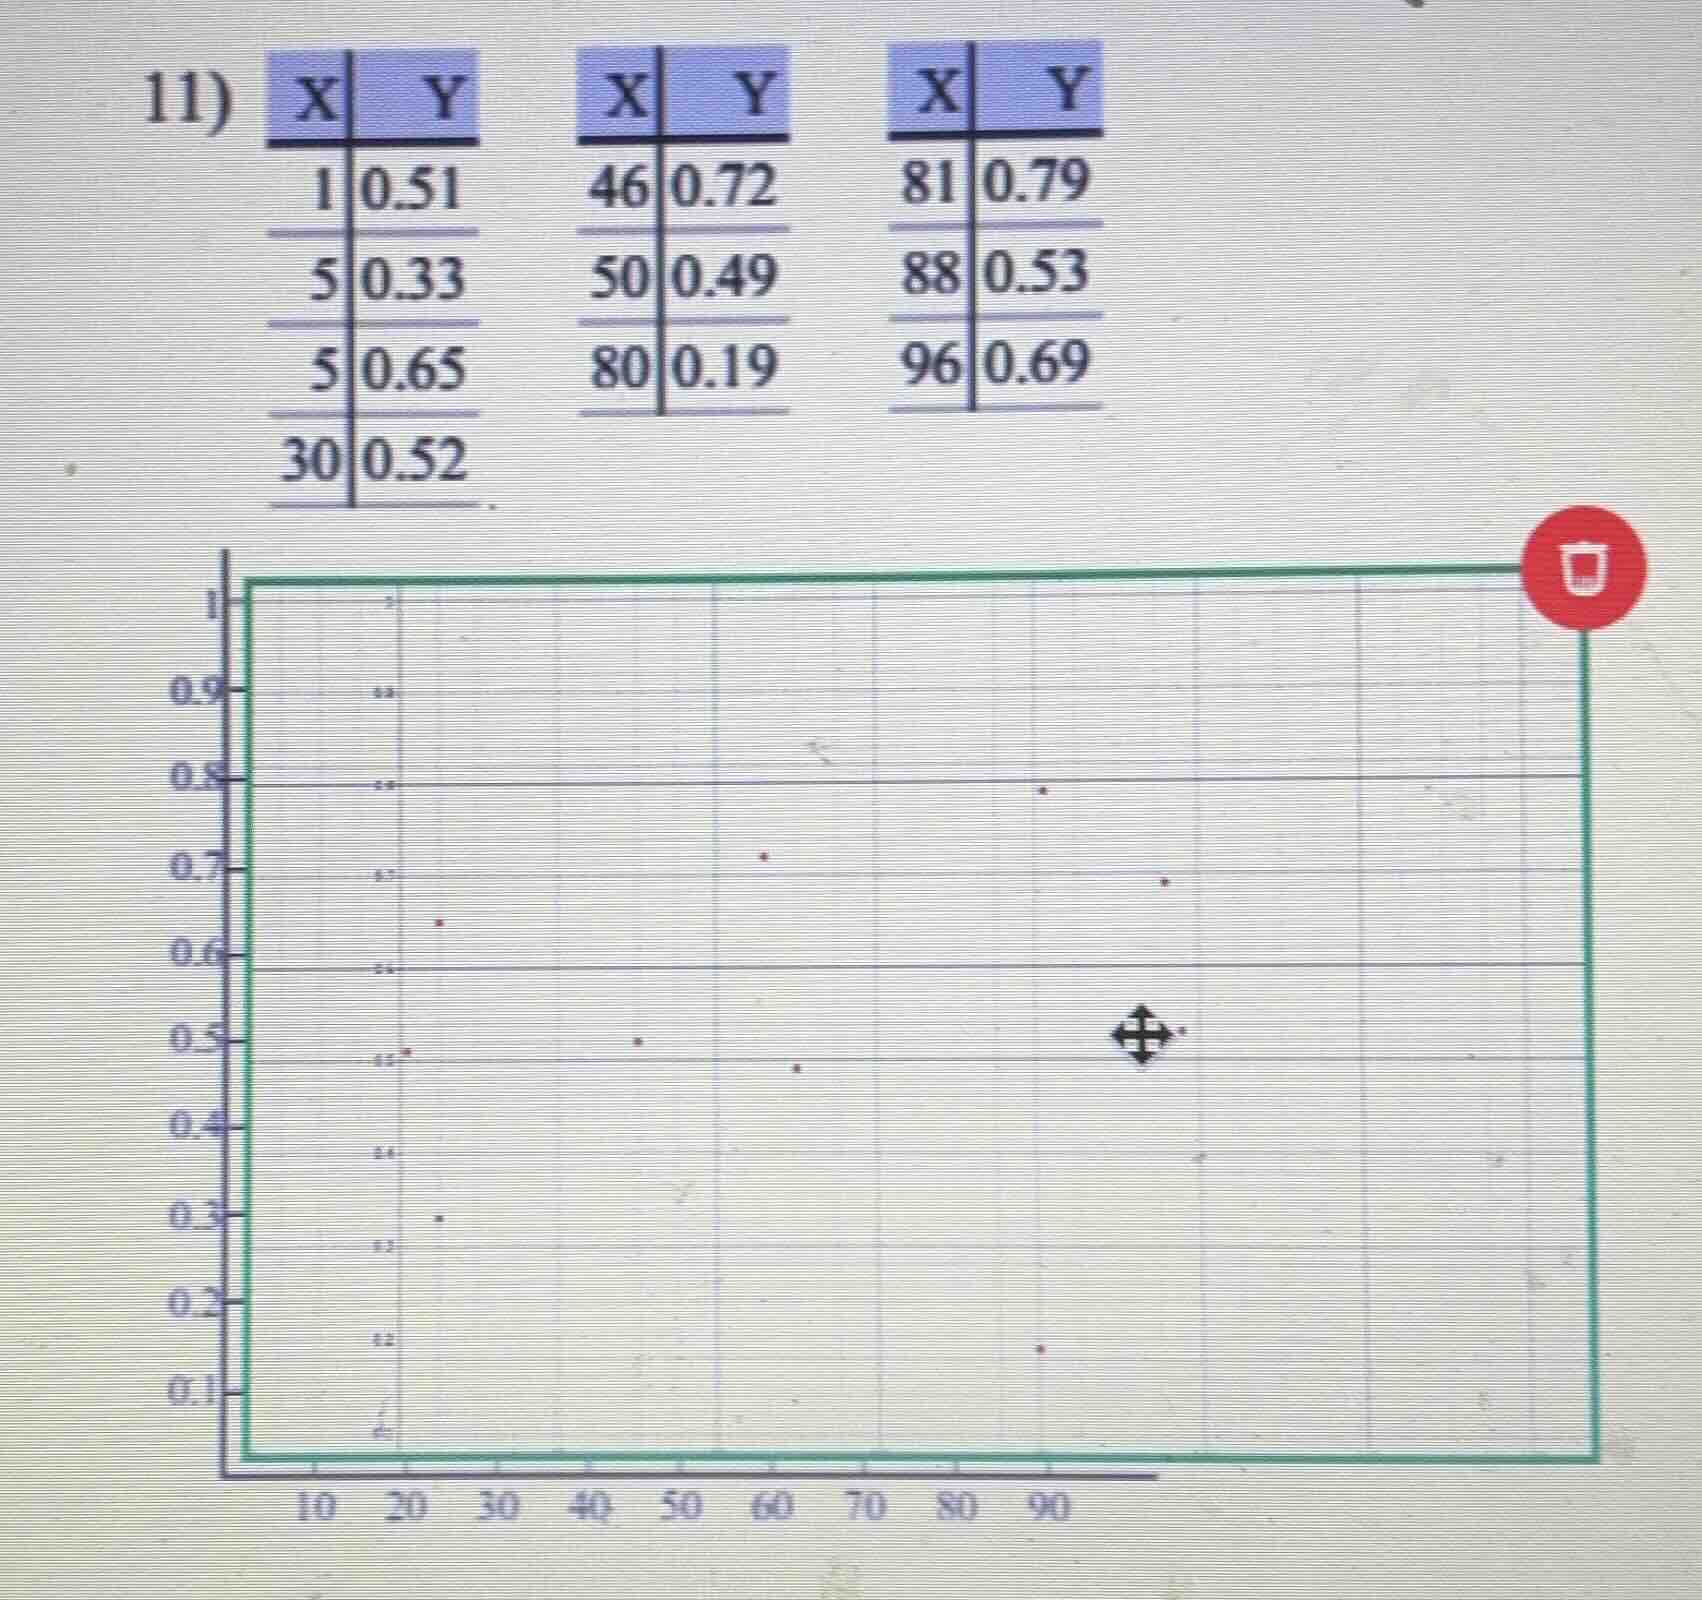
11) \n| x | y |\n|---|---|\n| 1 | 0.51 |\n| 5 | 0.33 |\n| 5 | 0.65 |\n| 30 | 0.52 |\n\n| x | y |\n|---|---|\n| 46 | 0.72 |\n| 50 | 0.49 |\n| 80 | 0.19 |\n\n| x | y |\n|---|---|\n| 81 | 0.79 |\n| 88 | 0.53 |\n| 96 | 0.69 |
Answer
Explanation:
Step1: Identify the data points from the tables
The given $(X, Y)$ pairs are: $(1, 0.51), (5, 0.33), (5, 0.65), (30, 0.52), (46, 0.72), (50, 0.49), (80, 0.19), (81, 0.79), (88, 0.53), (96, 0.69)$.
Step2: Plot points on the coordinate system
Locate each $X$ value on the horizontal axis and the corresponding $Y$ value on the vertical axis.
Step3: Verify the plotted points
Check the scatter plot to ensure each point from the table is represented by a dot at the correct intersection of the $X$ and $Y$ grid lines.
Answer:
The scatter plot is constructed by plotting the following points: $(1, 0.51), (5, 0.33), (5, 0.65), (30, 0.52), (46, 0.72), (50, 0.49), (80, 0.19), (81, 0.79), (88, 0.53), (96, 0.69)$.