12. nate conducted a random survey of 90 students at his school about their favorite class. based on the…
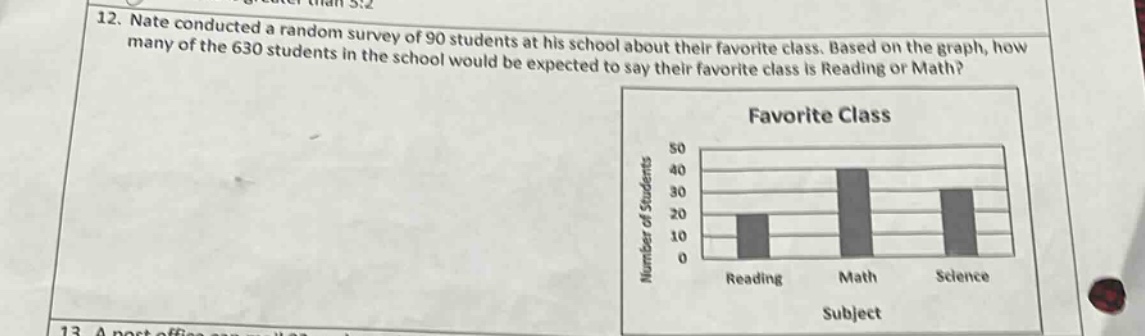
12. nate conducted a random survey of 90 students at his school about their favorite class. based on the graph, how many of the 630 students in the school would be expected to say their favorite class is reading or math? favorite class number of students 50 40 30 20 10 0 reading math science subject
Answer
Explanation:
Step1: Find number of students who like Reading or Math in survey
From the bar - graph, number of students who like Reading is 20 and Math is 40 in the survey of 90 students. So, the number of students who like Reading or Math in the survey is $20 + 40=60$.
Step2: Set up proportion
Let $x$ be the number of students in the school of 630 students who like Reading or Math. We set up the proportion $\frac{60}{90}=\frac{x}{630}$.
Step3: Solve the proportion
Cross - multiply: $90x = 60\times630$. Then $x=\frac{60\times630}{90}$. Calculate $60\times630 = 37800$, and $\frac{37800}{90}=420$.
Answer:
420