14 the bar graph shows the results of a survey of 50 seventh - graders about their favorite ice cream…
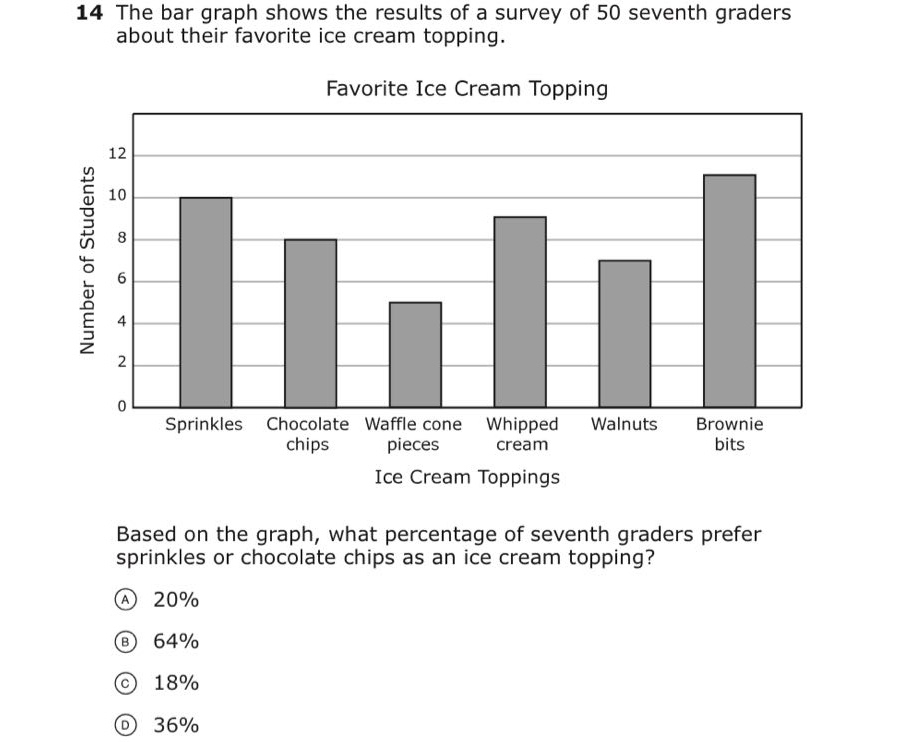
14 the bar graph shows the results of a survey of 50 seventh - graders about their favorite ice cream topping. favorite ice cream topping based on the graph, what percentage of seventh - graders prefer sprinkles or chocolate chips as an ice cream topping? a 20% b 64% c 18% d 36%
Answer
Explanation:
Step1: Find number of students who prefer sprinkles or chocolate chips
From the graph, number of students who prefer sprinkles is 10 and who prefer chocolate chips is 8. So the total number is $10 + 8=18$.
Step2: Calculate the percentage
The total number of students surveyed is 50. The percentage formula is $\frac{\text{Number of favorable students}}{\text{Total number of students}}\times100%$. So the percentage is $\frac{18}{50}\times 100%=\frac{18\times100}{50}% = 36%$.
Answer:
D. 36%