the 14 runners on the track team were asked how many miles they each ran last week. the results are shown in…
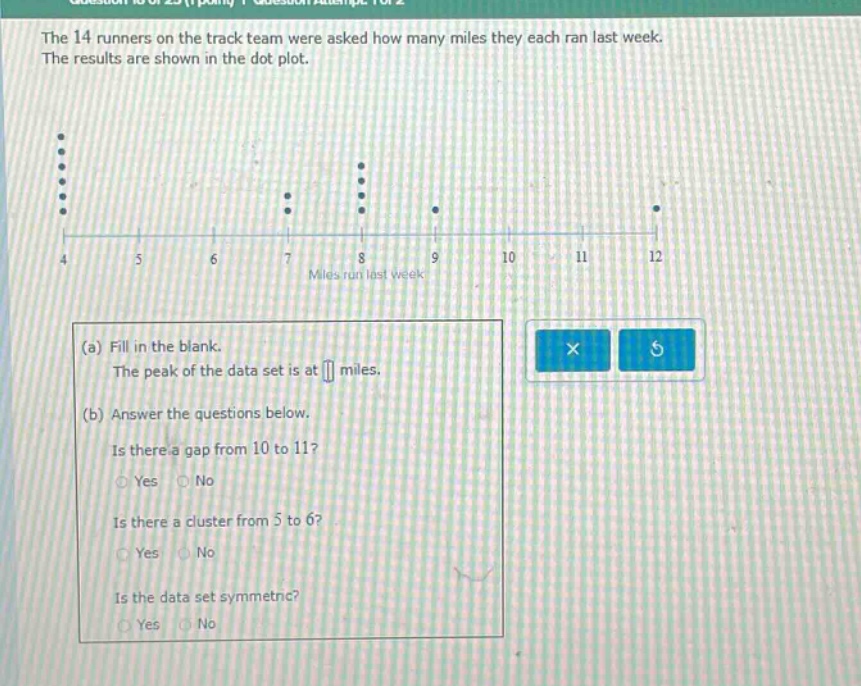
the 14 runners on the track team were asked how many miles they each ran last week. the results are shown in the dot - plot. (a) fill in the blank. the peak of the data set is at miles. (b) answer the questions below. is there a gap from 10 to 11? yes no is there a cluster from 5 to 6? yes no is the data set symmetric? yes no
Answer
Explanation:
Step1: Identify peak
The peak is where there are the most dots. There are 4 dots at 4 miles, which is the highest number of dots for a single value, so the peak is at 4 miles.
Step2: Check for gap
There are no dots from 10 to 11 on the dot - plot, so there is a gap.
Step3: Check for cluster
There are no dots from 5 to 6 on the dot - plot, so there is no cluster.
Step4: Check for symmetry
The data is not evenly distributed on both sides of any central value, so it is not symmetric.
Answer:
(a) 4 (b) Yes No No