the 15 data points represented in the graph make up a scatter plot. line m and line p are drawn to model the…
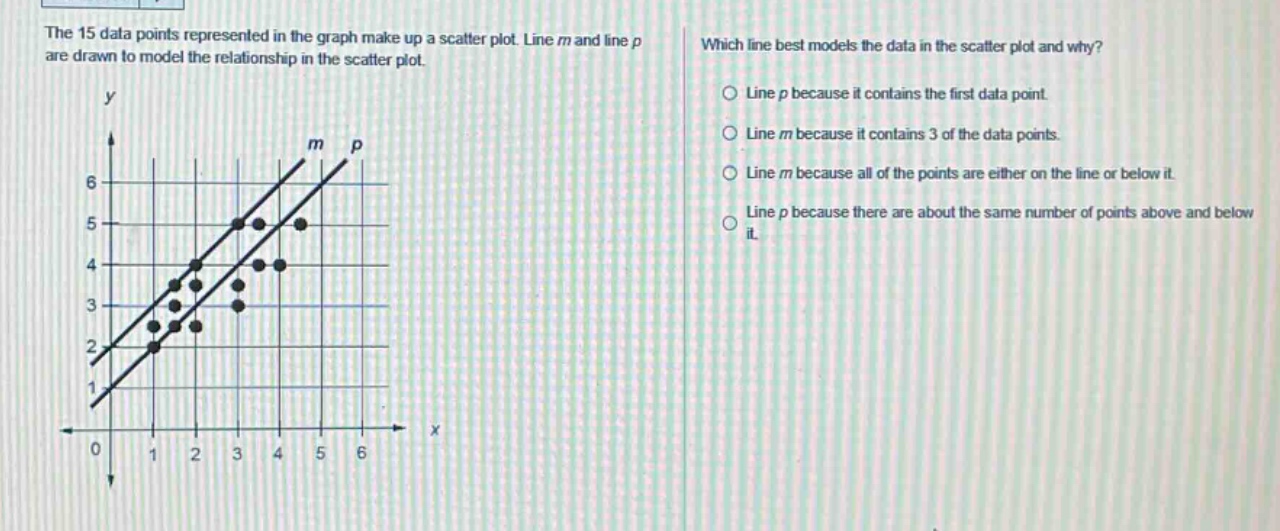
the 15 data points represented in the graph make up a scatter plot. line m and line p are drawn to model the relationship in the scatter plot. which line best models the data in the scatter plot and why? line p because it contains the first data point. line m because it contains 3 of the data points. line m because all of the points are either on the line or below it. line p because there are about the same number of points above and below it.
Answer
Explanation:
Step1: Recall line - of - best - fit concept
A line of best fit for a scatter - plot should balance the points above and below it as evenly as possible.
Step2: Analyze each option
- Option 1: Just because a line contains the first data point does not make it the best - fit line.
- Option 2: Containing 3 data points does not necessarily mean it is the best - fit line.
- Option 3: Having all points on or below a line is not the characteristic of a best - fit line. A best - fit line should account for points on both sides.
- Option 4: A line of best fit has approximately the same number of points above and below it. This is the correct criterion for a best - fit line.
Answer:
Line p because there are about the same number of points above and below it.