16 the dot plots below represent test scores for 20 students on a math test. the mode for this math test is…
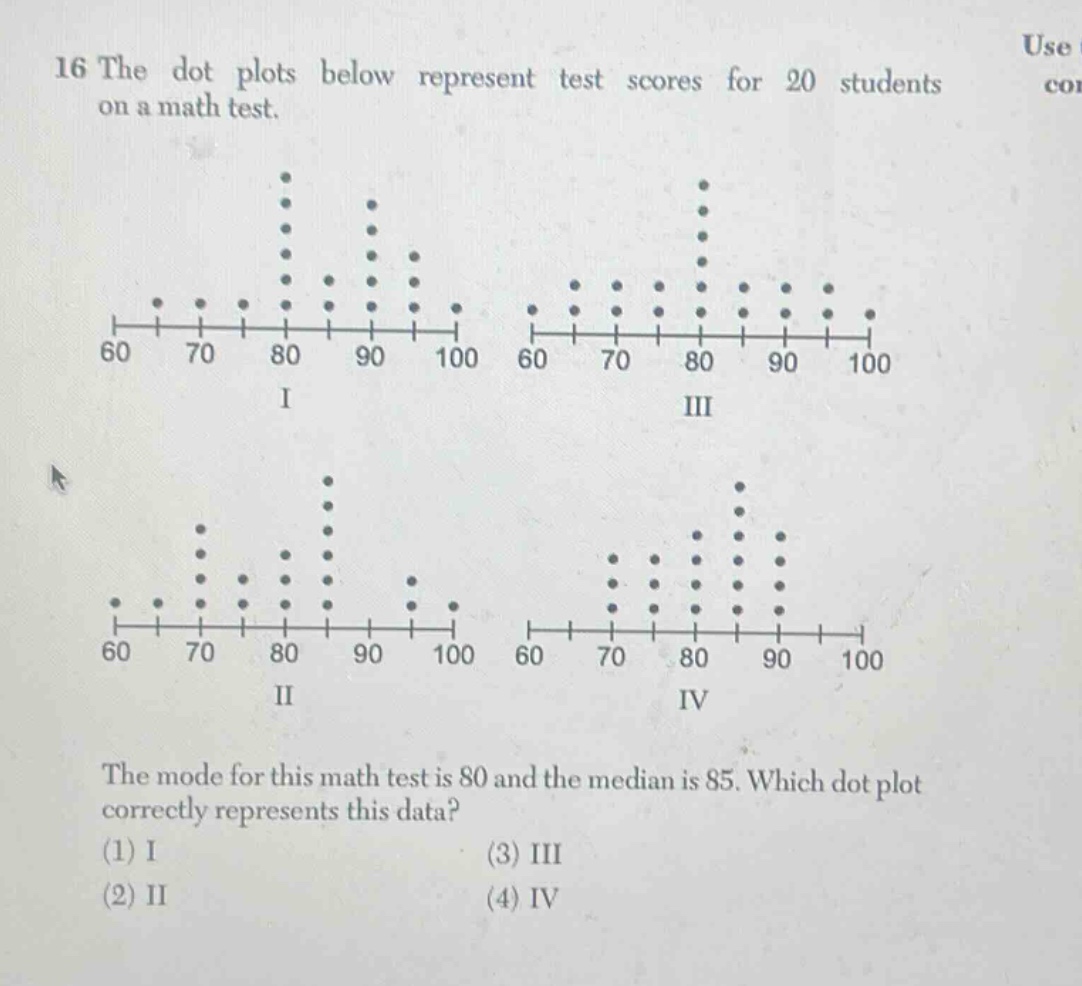
16 the dot plots below represent test scores for 20 students on a math test. the mode for this math test is 80 and the median is 85. which dot plot correctly represents this data? (1) i (2) ii (3) iii (4) iv
Answer
Answer:
(3) III
Explanation:
Step1: Recall mode definition
The mode is the most - frequently occurring value. In a dot - plot, it is the value with the most dots. We are given that the mode is 80, so we look for the dot - plot where 80 has the most dots. All plots have 80 as a possible mode candidate.
Step2: Recall median formula for (n = 20)
For (n = 20) (an even number of data points), the median is the average of the (\frac{n}{2}=10)th and ((\frac{n}{2}+ 1)=11)th ordered data points.
Step3: Analyze dot - plot III
In dot - plot III: - Count the number of dots from the left. When we count the dots, for the 10th and 11th ordered data points: - Arranging the data in ascending order, we find that the average of the 10th and 11th values gives a median of 85. Also, 80 has the most number of dots, so the mode is 80.