17. a scatter plot is shown. select all the statements that correctly interprets the graph. number of…
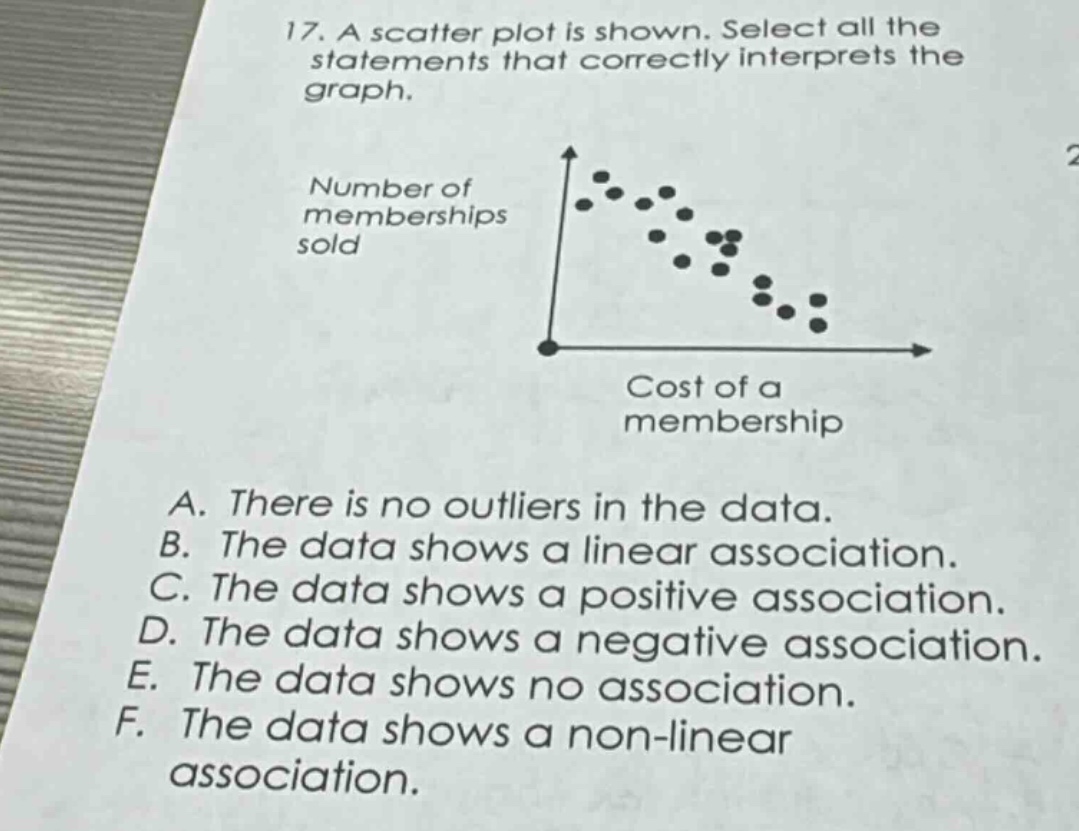
17. a scatter plot is shown. select all the statements that correctly interprets the graph. number of memberships sold cost of a membership a. there is no outliers in the data. b. the data shows a linear association. c. the data shows a positive association. d. the data shows a negative association. e. the data shows no association. f. the data shows a non - linear association.
Answer
Explanation:
Step1: Check for outliers
There are no points that are far - away from the general pattern of the other points, so there are no outliers.
Step2: Analyze the association type
As the cost of a membership increases, the number of memberships sold decreases. The points seem to follow a roughly straight - line pattern. This indicates a linear and negative association.
Answer:
A. There is no outliers in the data. B. The data shows a linear association. D. The data shows a negative association.