20 the table below shows the highest temperatures recorded in august for several years in one town.\n| year…
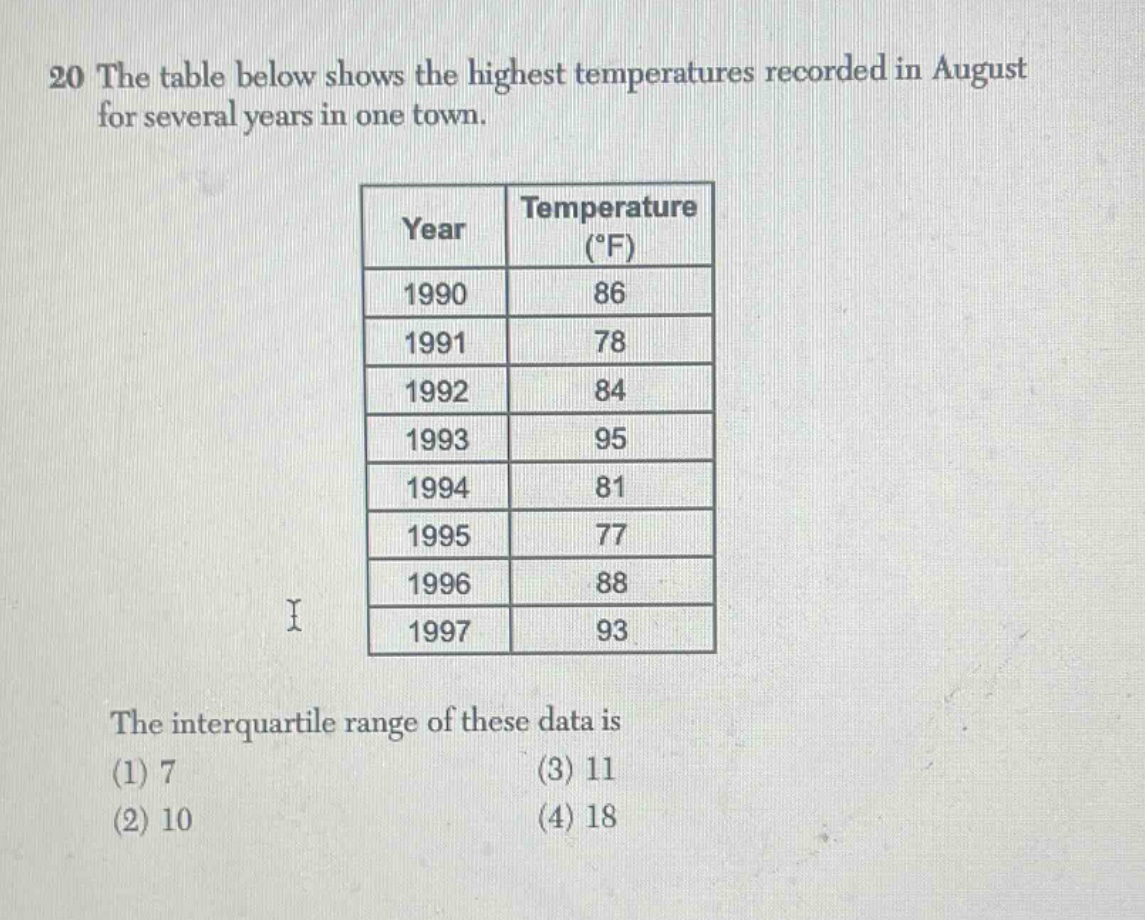
20 the table below shows the highest temperatures recorded in august for several years in one town.\n| year | temperature (°f) |\n| ---- | ---- |\n| 1990 | 86 |\n| 1991 | 78 |\n| 1992 | 84 |\n| 1993 | 95 |\n| 1994 | 81 |\n| 1995 | 77 |\n| 1996 | 88 |\n| 1997 | 93 |\nthe interquartile range of these data is\n(1) 7\n(2) 10\n(3) 11\n(4) 18
Answer
Answer:
(3) 11
Explanation:
Step1: Arrange data in ascending order
77, 78, 81, 84, 86, 88, 93, 95
Step2: Find median (Q2)
Since (n = 8) (even), (Q2=\frac{84 + 86}{2}=85)
Step3: Find lower - half data
77, 78, 81, 84. Median of lower - half (Q1) is (\frac{78+81}{2}=79.5)
Step4: Find upper - half data
86, 88, 93, 95. Median of upper - half (Q3) is (\frac{88 + 93}{2}=90.5)
Step5: Calculate inter - quartile range (IQR)
(IQR=Q3 - Q1=90.5-79.5 = 11)