2012 housing prices (thousands of dollars)\na report states the average selling price is almost $520,000…
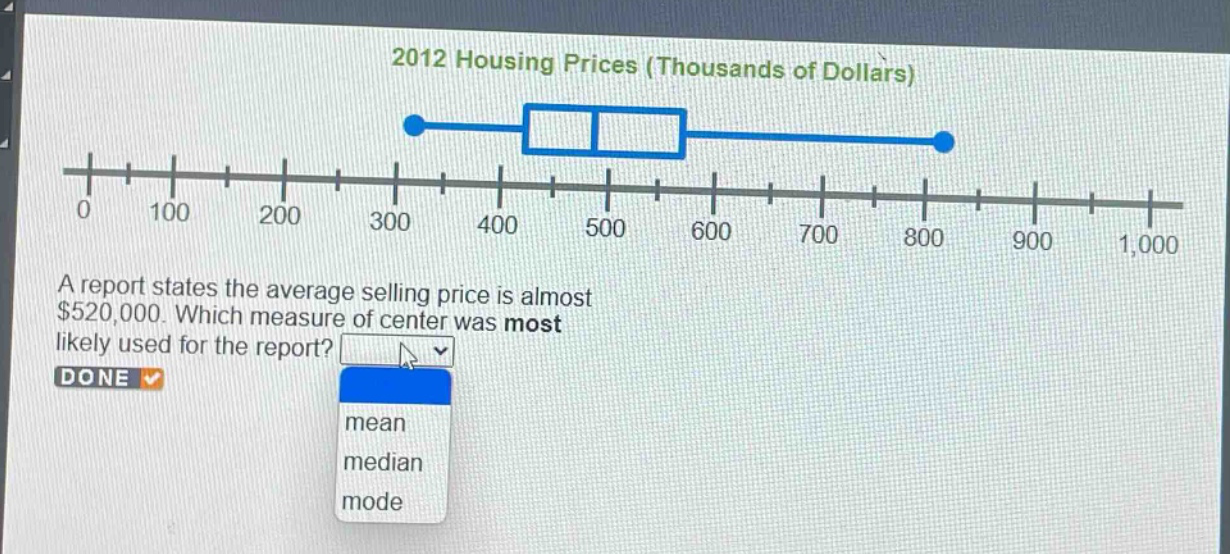
2012 housing prices (thousands of dollars)\na report states the average selling price is almost $520,000. which measure of center was most likely used for the report?\ndone\nmean\nmedian\nmode
Answer
Explanation:
Step1: Understand the measures of center
The mean is the sum of all values divided by the number of values. It is affected by outliers. The median is the middle - value when the data is ordered. The mode is the most frequently occurring value.
Step2: Analyze the box - and - whisker plot
From the box - and - whisker plot, we can see that the distribution may be skewed. In a skewed distribution, the mean is often pulled in the direction of the tail. If there are high - value outliers, the mean will be larger than the median.
Step3: Determine the measure of center
Since the average selling price is stated as $520,000 and in a skewed distribution (as indicated by the box - and - whisker plot) the mean is more likely to be affected by extreme values and be larger than the median and mode, the mean is the most likely measure of center used.
Answer:
mean