2012 housing prices (thousands of dollars)\na report states the average selling price is almost $520,000…
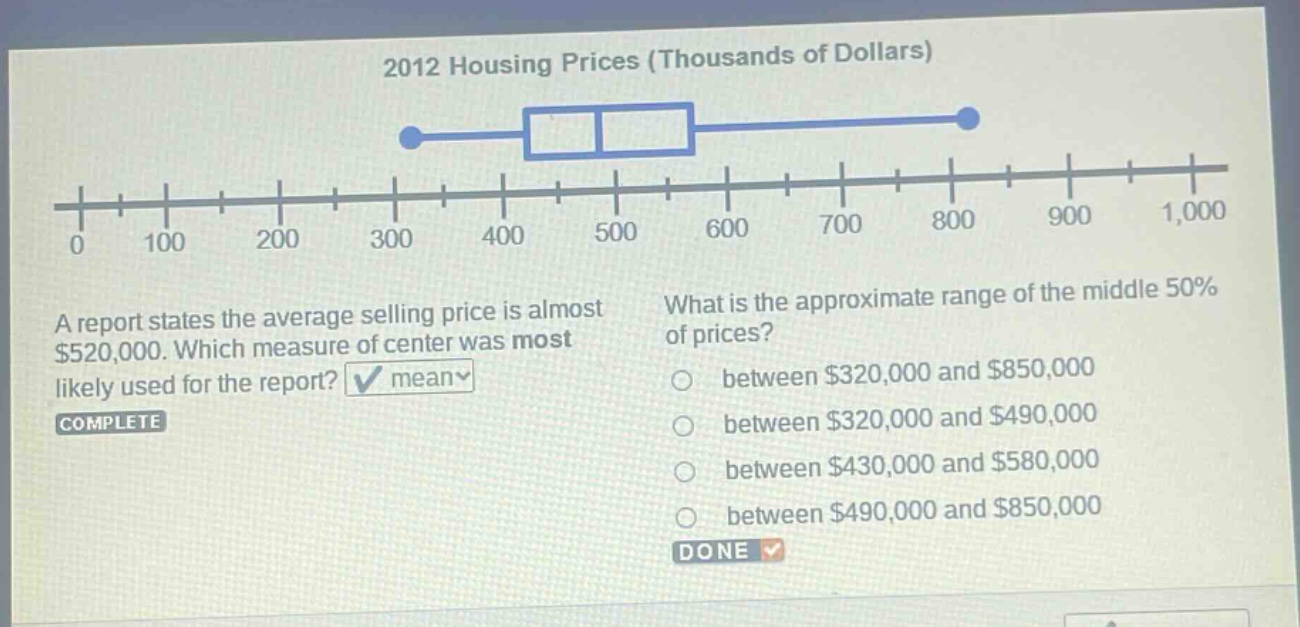
2012 housing prices (thousands of dollars)\na report states the average selling price is almost $520,000. which measure of center was most likely used for the report? mean\ncomplete\nwhat is the approximate range of the middle 50% of prices?\nbetween $320,000 and $850,000\nbetween $320,000 and $490,000\nbetween $430,000 and $580,000\nbetween $490,000 and $850,000\ndone
Answer
Answer:
between $430,000 and $580,000
Explanation:
Step1: Identify quartiles on box - plot
The box in a box - plot represents the middle 50% of the data. The lower end of the box is the first quartile ($Q_1$) and the upper end is the third quartile ($Q_3$).
Step2: Read values from plot
From the box - plot, $Q_1$ is approximately $430$ (in thousands of dollars) and $Q_3$ is approximately $580$ (in thousands of dollars). So the range of the middle 50% of prices is between $430,000 and $580,000.