2012 housing prices (thousands of dollars)\na report states the average selling price is almost $520,000…
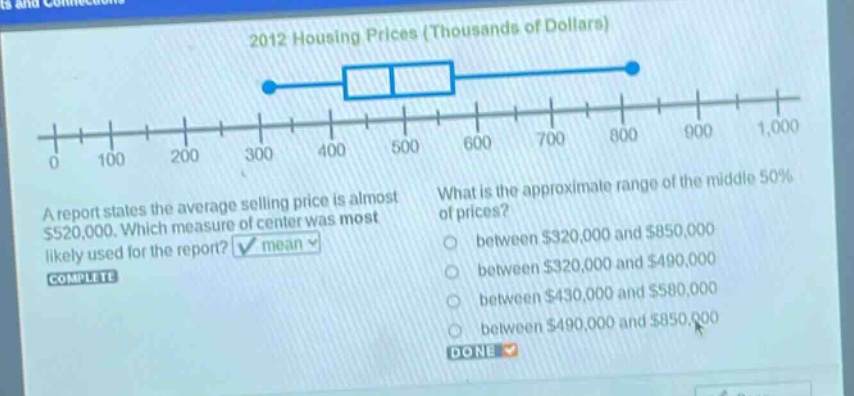
2012 housing prices (thousands of dollars)\na report states the average selling price is almost $520,000. which measure of center was most likely used for the report? mean\nwhat is the approximate range of the middle 50% of prices?\nbetween $320,000 and $850,000\nbetween $320,000 and $490,000\nbetween $430,000 and $580,000\nbetween $490,000 and $850,000
Answer
Explanation:
Step1: Identify the range representing the middle 50% of prices.
The middle 50% of the data in a box plot is represented by the Interquartile Range (IQR), which is the range between the first quartile (Q1) and the third quartile (Q3). These correspond to the left and right edges of the box, respectively.
Step2: Determine the approximate value of the first quartile (Q1).
Locate the left edge of the box on the horizontal axis. The left edge aligns approximately with the value 430 on the scale. Since the prices are in thousands of dollars, Q1 is approximately $430,000. $$ Q1 \approx 430 \text{ (Thousands of Dollars)} = $430,000 $$
Step3: Determine the approximate value of the third quartile (Q3).
Locate the right edge of the box on the horizontal axis. The right edge aligns approximately with the value 580 on the scale. Since the prices are in thousands of dollars, Q3 is approximately $580,000. $$ Q3 \approx 580 \text{ (Thousands of Dollars)} = $580,000 $$
Step4: State the approximate range of the middle 50% of prices.
The range of the middle 50% of prices is from Q1 to Q3. Based on the approximations from the plot, this range is between $430,000 and $580,000.
Answer:
between $430,000 and $580,000