in a 2019 article titled \americans want the wealthy and corporations to pay more taxes, but are elected…
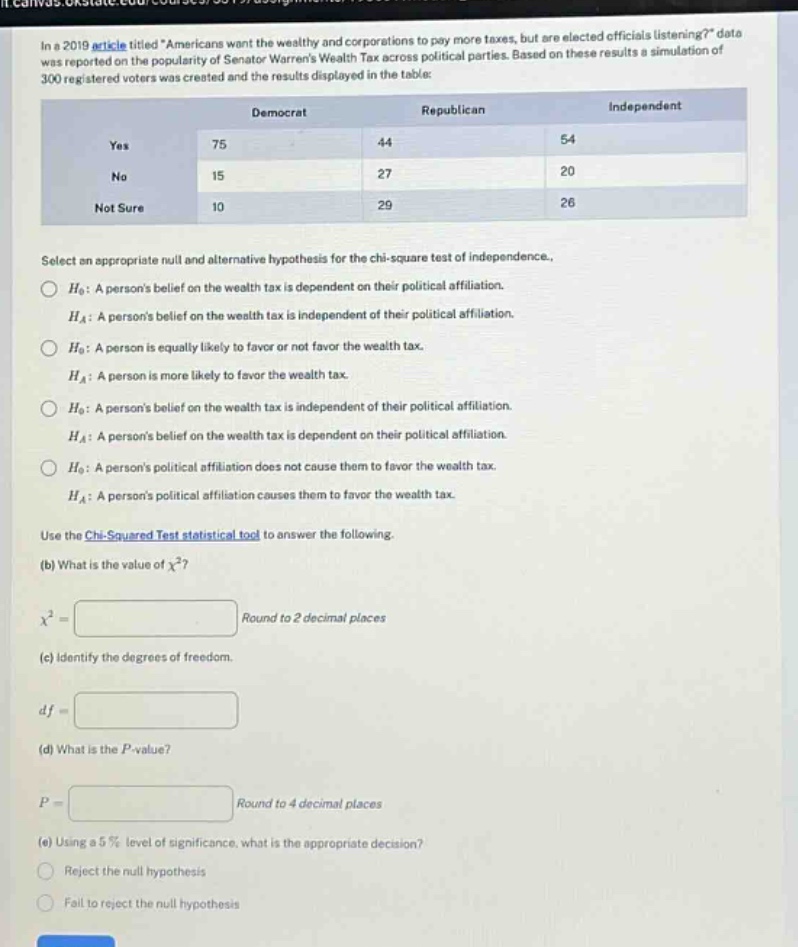
in a 2019 article titled \americans want the wealthy and corporations to pay more taxes, but are elected officials listening?\ data was reported on the popularity of senator warrens wealth tax across political parties. based on these results a simulation of 300 registered voters was created and the results displayed in the table:\n| |democrat|republican|independent|\n|----|----|----|----|\n|yes|75|44|54|\n|no|15|27|20|\n|not sure|10|29|26|\nselect an appropriate null and alternative hypothesis for the chi - square test of independence.\n$h_0$: a persons belief on the wealth tax is dependent on their political affiliation.\n$h_a$: a persons belief on the wealth tax is independent of their political affiliation.\n$h_0$: a person is equally likely to favor or not favor the wealth tax.\n$h_a$: a person is more likely to favor the wealth tax.\n$h_0$: a persons belief on the wealth tax is independent of their political affiliation.\n$h_a$: a persons belief on the wealth tax is dependent on their political affiliation.\n$h_0$: a persons political affiliation does not cause them to favor the wealth tax.\n$h_a$: a persons political affiliation causes them to favor the wealth tax.\nuse the chi - squared test statistical tool to answer the following.\n(b) what is the value of $chi^2$?\n$chi^2=\text{round to 2 decimal places}$\n(c) identify the degrees of freedom.\n$df = $\n(d) what is the $p$-value?\n$p=\text{round to 4 decimal places}$\n(e) using a 5% level of significance, what is the appropriate decision?\nreject the null hypothesis\nfail to reject the null hypothesis
Answer
Explanation:
Step1: State null and alternative hypotheses
The null hypothesis $H_0$ for a chi - square test of independence is that the two variables (belief on wealth tax and political affiliation) are independent, and the alternative hypothesis $H_A$ is that they are dependent. So $H_0$: A person's belief on the wealth tax is independent of their political affiliation; $H_A$: A person's belief on the wealth tax is dependent on their political affiliation.
Step2: Calculate expected frequencies
First, find the row and column totals. Row totals: Yes: $75 + 44+54=173$, No: $15 + 27+20 = 62$, Not Sure: $10+29 + 26=65$. Column totals: Democrat: $75 + 15+10 = 100$, Republican: $44+27 + 29=100$, Independent: $54+20+26 = 100$. Total number of observations $n=300$. The expected frequency formula is $E_{ij}=\frac{R_i\times C_j}{n}$, where $R_i$ is the $i$-th row total and $C_j$ is the $j$-th column total. For example, for the cell (Yes, Democrat), $E_{11}=\frac{173\times100}{300}\approx57.67$. Calculate all expected frequencies and then use the formula $\chi^{2}=\sum\frac{(O - E)^{2}}{E}$, where $O$ is the observed frequency and $E$ is the expected frequency. After calculation, $\chi^{2}\approx26.92$.
Step3: Calculate degrees of freedom
The formula for degrees of freedom in a contingency table with $r$ rows and $c$ columns is $df=(r - 1)\times(c - 1)$. Here $r = 3$ (Yes, No, Not Sure) and $c=3$ (Democrat, Republican, Independent), so $df=(3 - 1)\times(3 - 1)=4$.
Step4: Calculate P - value
Using a chi - square distribution table or a statistical software with $\chi^{2}=26.92$ and $df = 4$, the $P$-value is approximately $0.0000$.
Step5: Make a decision
Since the $P$-value ($\approx0.0000$) is less than the significance level $\alpha = 0.05$, we reject the null hypothesis.
Answer:
- For the null and alternative hypotheses: $H_0$: A person's belief on the wealth tax is independent of their political affiliation; $H_A$: A person's belief on the wealth tax is dependent on their political affiliation.
- (b) $\chi^{2}\approx26.92$
- (c) $df = 4$
- (d) $P\approx0.0000$
- (e) Reject the null hypothesis