29. the distance d in kilometers that tricia runs was measured at different times t minutes after she…
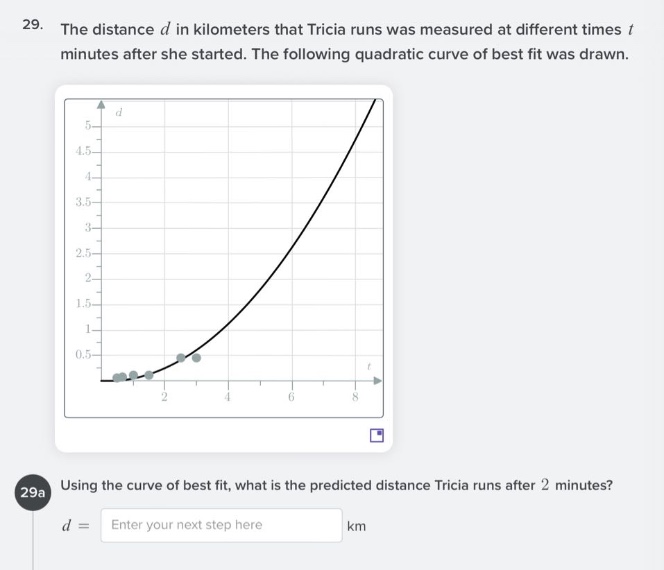
29. the distance d in kilometers that tricia runs was measured at different times t minutes after she started. the following quadratic curve of best fit was drawn. 29a using the curve of best fit, what is the predicted distance tricia runs after 2 minutes? d = enter your next step here km
Answer
Explanation:
Step1: Locate t = 2 on x - axis
Find the value of t = 2 on the horizontal axis (t - axis) of the graph.
Step2: Read corresponding d - value
Move vertically from t = 2 until you reach the curve of best - fit, then move horizontally to the left to read the corresponding value on the vertical axis (d - axis). From the graph, when t = 2, the value of d is approximately 0.5 km.
Answer:
0.5