34 the table below shows the number of sat prep classes five students attended and the scores they received…
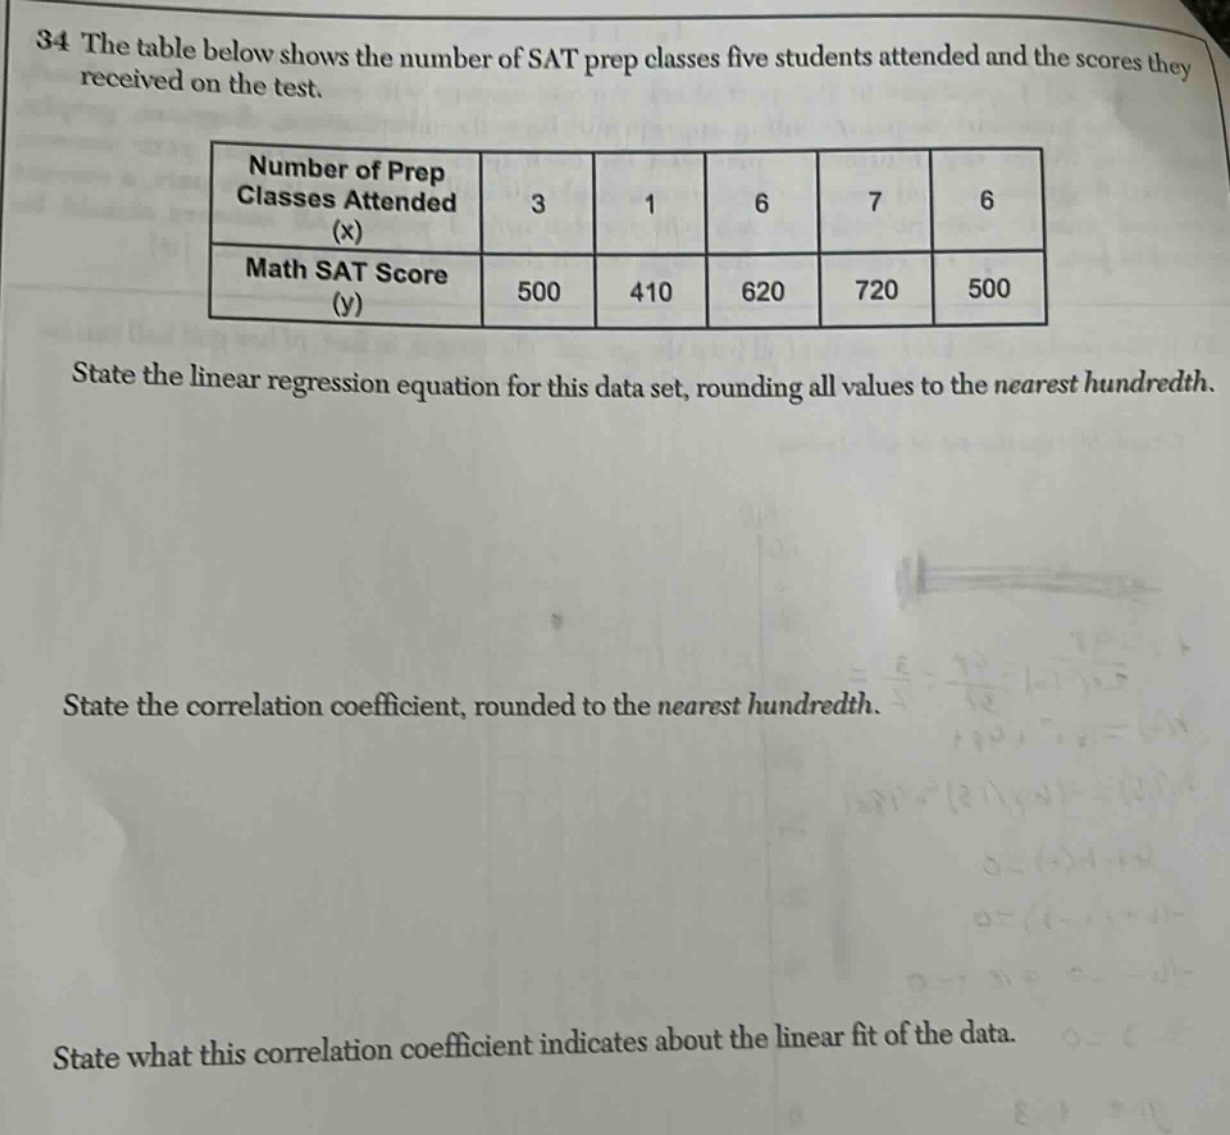
34 the table below shows the number of sat prep classes five students attended and the scores they received on the test.\n| number of prep classes attended (x) | 3 | 1 | 6 | 7 | 6 |\n| math sat score (y) | 500 | 410 | 620 | 720 | 500 |\nstate the linear regression equation for this data set, rounding all values to the nearest hundredth.\nstate the correlation coefficient, rounded to the nearest hundredth.\nstate what this correlation coefficient indicates about the linear fit of the data.
Answer
Explanation:
Step1: Calculate the means of (x) and (y)
Let (x = [3,1,6,7,6]) and (y=[500,410,620,720,500]). (\bar{x}=\frac{3 + 1+6+7+6}{5}=\frac{23}{5} = 4.6) (\bar{y}=\frac{500+410+620+720+500}{5}=\frac{2750}{5}=550)
Step2: Calculate the numerator and denominator for the slope (b_1)
The formula for (b_1=\frac{\sum_{i = 1}^{n}(x_i-\bar{x})(y_i - \bar{y})}{\sum_{i=1}^{n}(x_i-\bar{x})^2}) ((x_1-\bar{x})(y_1 - \bar{y})=(3 - 4.6)(500 - 550)=(-1.6)\times(- 50)=80) ((x_2-\bar{x})(y_2 - \bar{y})=(1 - 4.6)(410 - 550)=(-3.6)\times(-140) = 504) ((x_3-\bar{x})(y_3 - \bar{y})=(6 - 4.6)(620 - 550)=1.4\times70 = 98) ((x_4-\bar{x})(y_4 - \bar{y})=(7 - 4.6)(720 - 550)=2.4\times170 = 408) ((x_5-\bar{x})(y_5 - \bar{y})=(6 - 4.6)(500 - 550)=1.4\times(-50)=-70) (\sum_{i = 1}^{5}(x_i-\bar{x})(y_i - \bar{y})=80 + 504+98+408-70=1020) ((x_1-\bar{x})^2=(3 - 4.6)^2=(-1.6)^2 = 2.56) ((x_2-\bar{x})^2=(1 - 4.6)^2=(-3.6)^2 = 12.96) ((x_3-\bar{x})^2=(6 - 4.6)^2=1.4^2 = 1.96) ((x_4-\bar{x})^2=(7 - 4.6)^2=2.4^2 = 5.76) ((x_5-\bar{x})^2=(6 - 4.6)^2=1.4^2 = 1.96) (\sum_{i=1}^{5}(x_i-\bar{x})^2=2.56+12.96 + 1.96+5.76+1.96=25.2) (b_1=\frac{1020}{25.2}\approx40.48)
Step3: Calculate the y - intercept (b_0)
The formula for (b_0=\bar{y}-b_1\bar{x}) (b_0 = 550-40.48\times4.6=550 - 186.21=363.79) The linear - regression equation is (y = 363.79+40.48x)
Step4: Calculate the correlation coefficient (r)
The formula for (r=\frac{\sum_{i = 1}^{n}(x_i-\bar{x})(y_i - \bar{y})}{\sqrt{\sum_{i=1}^{n}(x_i-\bar{x})^2\sum_{i = 1}^{n}(y_i-\bar{y})^2}}) We already know (\sum_{i = 1}^{n}(x_i-\bar{x})(y_i - \bar{y}) = 1020) and (\sum_{i=1}^{n}(x_i-\bar{x})^2=25.2) ((y_1-\bar{y})^2=(500 - 550)^2=(-50)^2 = 2500) ((y_2-\bar{y})^2=(410 - 550)^2=(-140)^2 = 19600) ((y_3-\bar{y})^2=(620 - 550)^2=70^2 = 4900) ((y_4-\bar{y})^2=(720 - 550)^2=170^2 = 28900) ((y_5-\bar{y})^2=(500 - 550)^2=(-50)^2 = 2500) (\sum_{i = 1}^{n}(y_i-\bar{y})^2=2500+19600+4900+28900+2500=58400) (r=\frac{1020}{\sqrt{25.2\times58400}}=\frac{1020}{\sqrt{1471680}}\approx\frac{1020}{1213.13}\approx0.84)
Step5: Interpret the correlation coefficient
A correlation coefficient (r = 0.84) indicates a strong positive linear relationship. As the number of SAT - prep classes attended increases, the Math SAT score tends to increase.
Answer:
The linear regression equation is (y = 363.79+40.48x). The correlation coefficient is (r\approx0.84). The correlation coefficient indicates a strong positive linear relationship between the number of SAT - prep classes attended and the Math SAT score.