the accompanying table gives the number of copies sold for 30 top - selling novels. use data given in the…
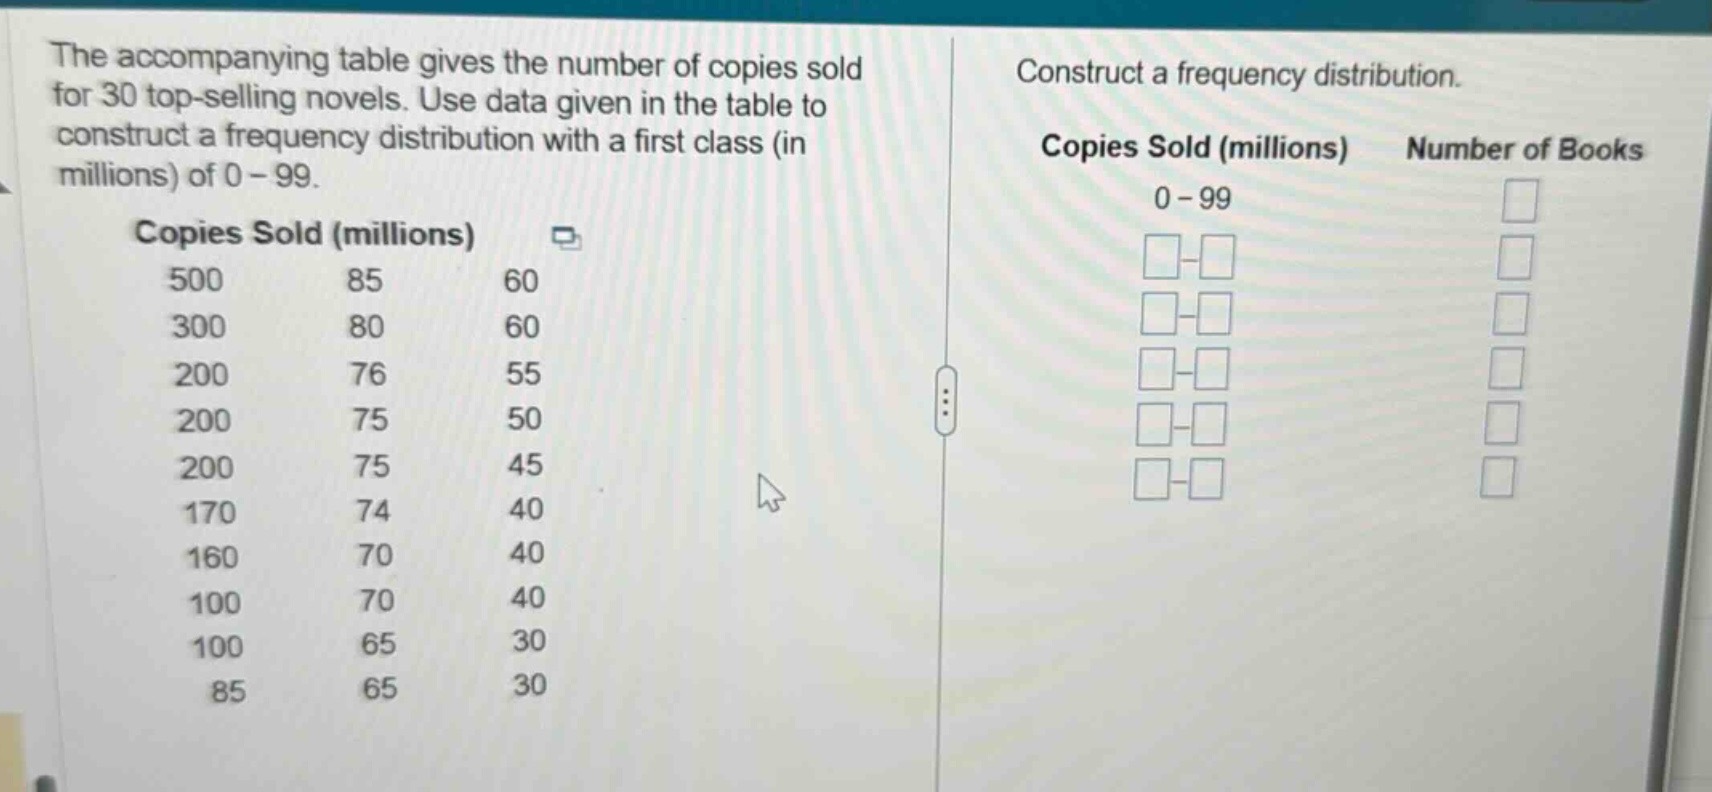
the accompanying table gives the number of copies sold for 30 top - selling novels. use data given in the table to construct a frequency distribution with a first class (in millions) of 0 - 99.\ncopies sold (millions)\n500 85 60\n300 80 60\n200 76 55\n200 75 50\n200 75 45\n170 74 40\n160 70 40\n100 70 40\n100 65 30\n85 65 30\nconstruct a frequency distribution.\ncopies sold (millions) number of books\n0 - 99
Answer
Explanation:
Step1: Define frequency - counting
Count the number of data values in each class.
Step2: Analyze class 0 - 99
Go through the list of copies - sold values and count how many are in the range 0 - 99. Let's count: 85, 60, 80, 60, 76, 55, 75, 50, 75, 45, 74, 40, 70, 40, 70, 65, 30, 65, 30, 85. The number of values in the range 0 - 99 is 20. We can assume the following class intervals (you can adjust based on the data spread): 0 - 99, 100 - 199, 200 - 299, 300 - 399, 400 - 499, 500 - 599. For 100 - 199: 170, 160, 100, 100, there are 4 values. For 200 - 299: 200, 200, 200, there are 3 values. For 300 - 399: 300, there is 1 value. For 400 - 499: 0 values. For 500 - 599: 500, there is 1 value.
Answer:
| Copies Sold (millions) | Number of Books |
|---|---|
| 0 - 99 | 20 |
| 100 - 199 | 4 |
| 200 - 299 | 3 |
| 300 - 399 | 1 |
| 400 - 499 | 0 |
| 500 - 599 | 1 |