adam recorded the number of flower blooms on each of his ten rose bushes. 9, 10, 4, 12, 15, 17, 18, 10, 12…
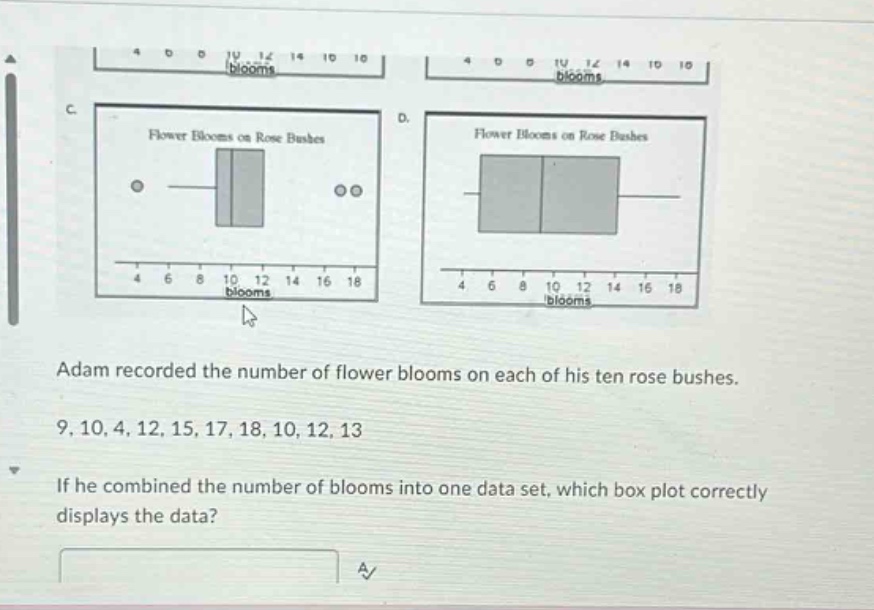
adam recorded the number of flower blooms on each of his ten rose bushes. 9, 10, 4, 12, 15, 17, 18, 10, 12, 13. if he combined the number of blooms into one data set, which box plot correctly displays the data?
Answer
Explanation:
Step1: Arrange data in ascending order
$4,9,10,10,12,12,13,15,17,18$
Step2: Find the median (Q2)
Since there are 10 data - points, the median is the average of the 5th and 6th ordered values. So, $Q2=\frac{12 + 12}{2}=12$.
Step3: Find the lower half of data
The lower half is $4,9,10,10,12$. The median of the lower half (Q1) is 10.
Step4: Find the upper half of data
The upper half is $12,13,15,17,18$. The median of the upper half (Q3) is 15.
Step5: Identify the minimum and maximum
The minimum value is 4 and the maximum value is 18.
Answer:
The box - plot with minimum value at 4, Q1 at 10, Q2 at 12, Q3 at 15 and maximum value at 18 is the correct one. (Without seeing all the options clearly, we can't specify which lettered option it is, but you can identify it based on these values).