8 - 2 additional practice\nin 1 and 2, find the mean of the data given.\n1. number of pets in six families…
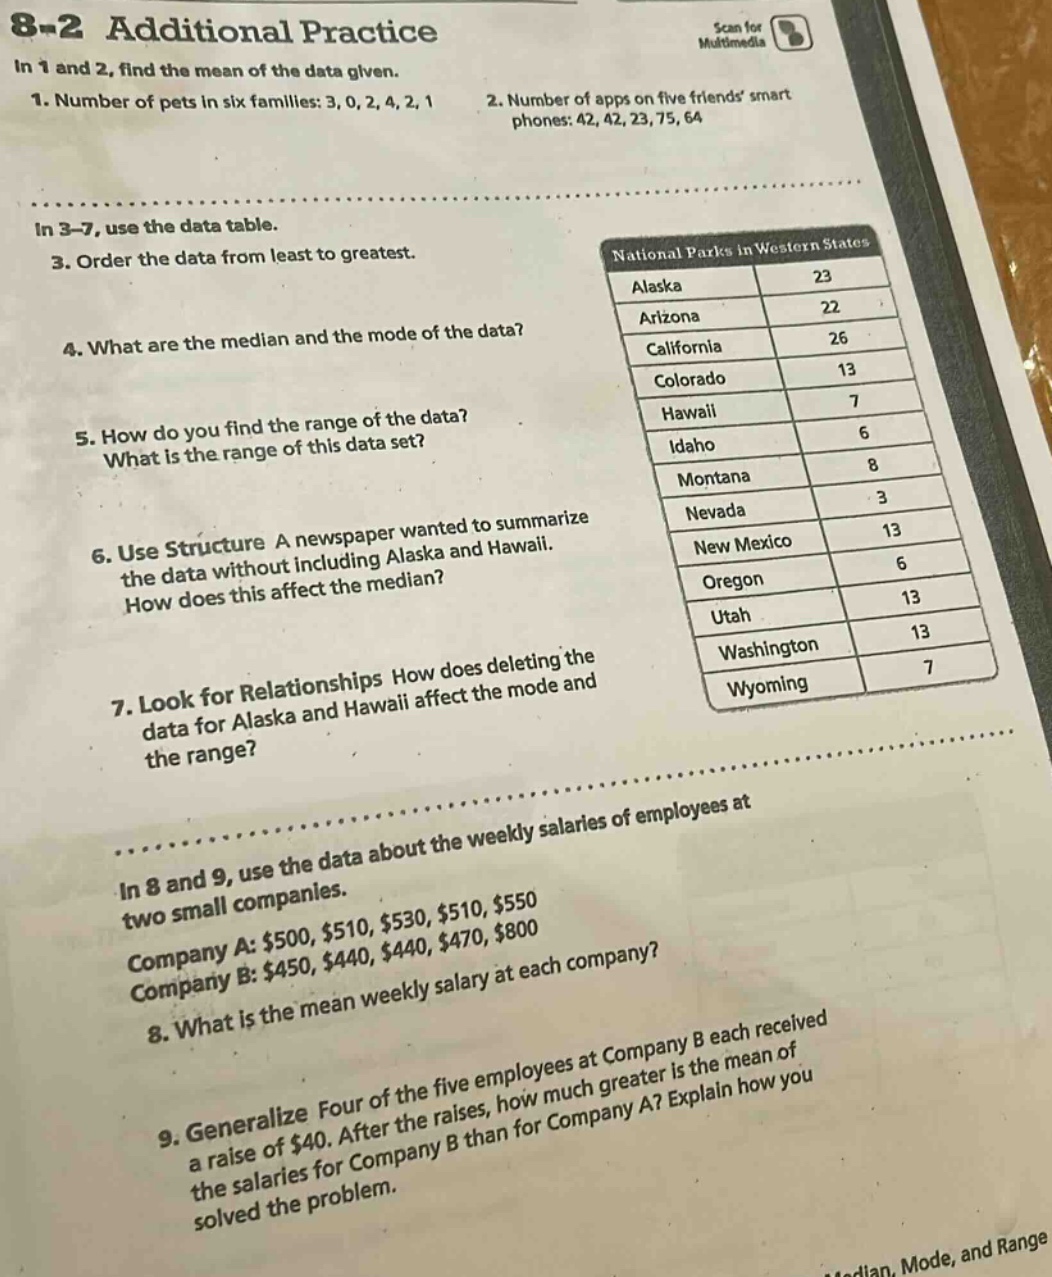
8 - 2 additional practice\nin 1 and 2, find the mean of the data given.\n1. number of pets in six families: 3, 0, 2, 4, 2, 1\n2. number of apps on five friends smart - phones: 42, 42, 23, 75, 64\nin 3 - 7, use the data table.\n3. order the data from least to greatest.\n4. what are the median and the mode of the data?\n5. how do you find the range of the data? what is the range of this data set?\n6. use structure a newspaper wanted to summarize the data without including alaska and hawaii. how does this affect the median?\n7. look for relationships how does deleting the data for alaska and hawaii affect the mode and the range?\nin 8 and 9, use the data about the weekly salaries of employees at two small companies.\ncompany a: $500, $510, $530, $510, $550\ncompany b: $450, $440, $440, $470, $800\n8. what is the mean weekly salary at each company?\n9. generalize four of the five employees at company b each received a raise of $40. after the raises, how much greater is the mean of the salaries for company b than for company a? explain how you solved the problem.
Answer
1. Find the mean of the number of pets in six families: 3, 0, 2, 4, 2, 1
Explanation:
Step1: Recall the mean formula
The mean $\bar{x}=\frac{\sum_{i = 1}^{n}x_{i}}{n}$, where $x_{i}$ are the data - points and $n$ is the number of data - points. Here, $n = 6$, $x_1=3,x_2 = 0,x_3=2,x_4 = 4,x_5=2,x_6=1$.
Step2: Calculate the sum of the data
$\sum_{i = 1}^{6}x_{i}=3 + 0+2 + 4+2 + 1=12$.
Step3: Calculate the mean
$\bar{x}=\frac{12}{6}=2$.
2. Find the mean of the number of apps on five friends' smart - phones: 42, 42, 23, 75, 64
Explanation:
Step1: Recall the mean formula
The mean $\bar{x}=\frac{\sum_{i = 1}^{n}x_{i}}{n}$, where $n = 5$, $x_1 = 42,x_2=42,x_3 = 23,x_4=75,x_5=64$.
Step2: Calculate the sum of the data
$\sum_{i = 1}^{5}x_{i}=42+42 + 23+75+64=246$.
Step3: Calculate the mean
$\bar{x}=\frac{246}{5}=49.2$.
3. Order the data of national parks in western states from least to greatest
3, 6, 6, 7, 7, 8, 13, 13, 13, 13, 22, 23, 26
4. Find the median and the mode of the data of national parks in western states
Explanation:
Step1: Find the number of data - points
There are $n = 13$ data - points.
Step2: Find the median
Since $n = 13$ (odd), the median is the $\left(\frac{n + 1}{2}\right)$-th value. $\frac{13+1}{2}=7$th value. So the median is 13.
Step3: Find the mode
The mode is the value that appears most frequently. The number 13 appears 4 times, more frequently than any other number. So the mode is 13.
5. How to find the range of the data and what is the range of this data set
Explanation:
Step1: Recall the range formula
The range $R=\text{Max}-\text{Min}$, where $\text{Max}$ is the maximum value and $\text{Min}$ is the minimum value in the data set.
Step2: Identify the maximum and minimum values
The maximum value is 26 and the minimum value is 3.
Step3: Calculate the range
$R=26 - 3=23$.
6. Use Structure: A newspaper wanted to summarize the data without including Alaska and Hawaii. How does this affect the median?
Explanation:
Step1: Original data set size and median
The original data set has $n = 13$ values with median 13.
Step2: New data set after exclusion
After excluding Alaska (23) and Hawaii (7), the new data set has $n = 11$ values.
Step3: Calculate the new median
Since $n = 11$ (odd), the median is the $\left(\frac{n + 1}{2}\right)$-th value. $\frac{11 + 1}{2}=6$th value. The ordered new data set is 3, 6, 6, 8, 13, 13, 13, 13, 22, 26. The median is still 13. So the median does not change.
7. Look for Relationships: How does deleting the data for Alaska and Hawaii affect the mode and the range?
Explanation:
Step1: Original mode and range
The original mode is 13 and the original range is 23.
Step2: New mode
After deleting Alaska (23) and Hawaii (7), the mode is still 13.
Step3: New range
The new maximum is 26 and the new minimum is 3. The new range is $26-3 = 23$. So the mode and the range do not change.
8. What is the mean weekly salary at each company?
Company A: $500, $510, $530, $510, $550
Explanation:
Step1: Recall the mean formula
The mean $\bar{x}=\frac{\sum_{i = 1}^{n}x_{i}}{n}$, where $n = 5$, $x_1 = 500,x_2=510,x_3 = 530,x_4=510,x_5=550$.
Step2: Calculate the sum of the data
$\sum_{i = 1}^{5}x_{i}=500+510+530+510+550 = 2600$.
Step3: Calculate the mean
$\bar{x}=\frac{2600}{5}=520$.
Company B: $450, $440, $440, $470, $800
Explanation:
Step1: Recall the mean formula
The mean $\bar{x}=\frac{\sum_{i = 1}^{n}x_{i}}{n}$, where $n = 5$, $x_1 = 450,x_2=440,x_3 = 440,x_4=470,x_5=800$.
Step2: Calculate the sum of the data
$\sum_{i = 1}^{5}x_{i}=450+440+440+470+800 = 2600$.
Step3: Calculate the mean
$\bar{x}=\frac{2600}{5}=520$.
9. Generalize: Four of the five employees at Company B each received a raise of $40$. After the raises, how much greater is the mean of the salaries for Company B than for Company A? Explain how you solved the problem.
Explanation:
Step1: Calculate the new sum for Company B
The original sum for Company B was 2600. Four employees got a raise of 40 each, so the new sum is $2600+4\times40=2600 + 160=2760$.
Step2: Calculate the new mean for Company B
The new mean for Company B is $\frac{2760}{5}=552$.
Step3: Calculate the difference
The mean for Company A is 520. The difference is $552-520 = 32$.
Answer:
- Mean of number of pets: 2
- Mean of number of apps: 49.2
- Ordered data: 3, 6, 6, 7, 7, 8, 13, 13, 13, 13, 22, 23, 26
- Median: 13, Mode: 13
- Range formula: $R=\text{Max}-\text{Min}$, Range: 23
- Median does not change.
- Mode and range do not change.
- Company A mean: 520, Company B mean: 520
- 32