the ages of the people who came to a birthday party are shown below. which statements must be true according…
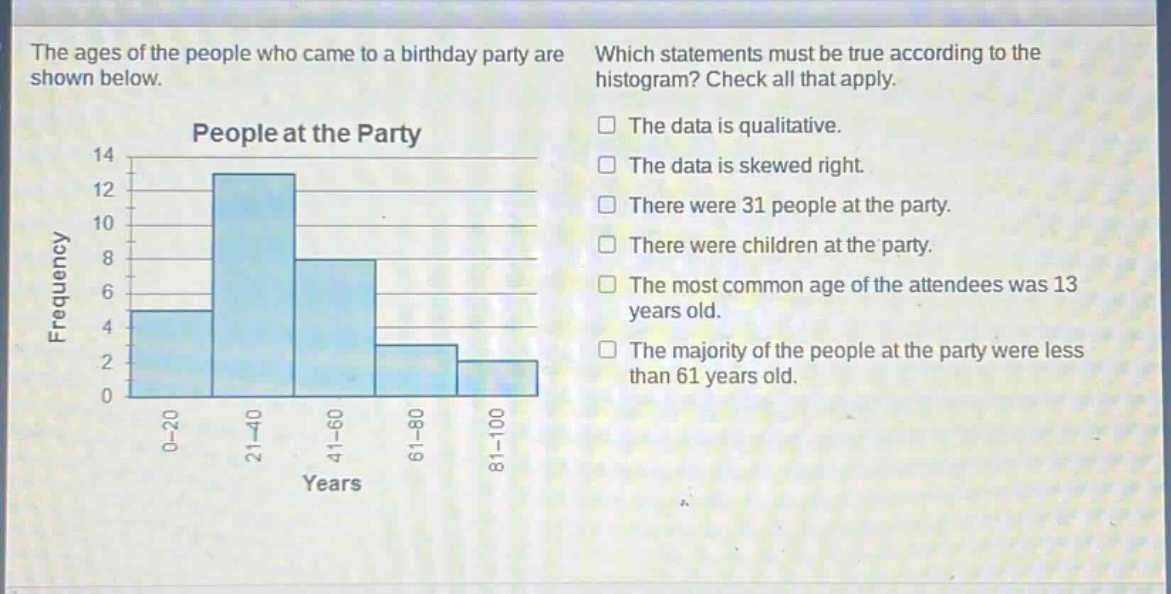
the ages of the people who came to a birthday party are shown below. which statements must be true according to the histogram? check all that apply. the data is qualitative. the data is skewed right. there were 31 people at the party. there were children at the party. the most common age of the attendees was 13 years old. the majority of the people at the party were less than 61 years old.
Answer
Explanation:
Step1: Analyze data type
Age is a quantitative variable, so the data is not qualitative.
Step2: Check skewness
The histogram has a longer tail on the left, so it is skewed left, not right.
Step3: Calculate number of people
Sum the frequencies: $5 + 13+8 + 3+2=31$.
Step4: Check for children
The $0 - 20$ age - group indicates the presence of children.
Step5: Determine most common age
The age - group $21 - 40$ has the highest frequency, but we can't say the most common age is 13.
Step6: Analyze age distribution
The sum of frequencies of age - groups $0 - 20$, $21 - 40$, and $41 - 60$ is $5 + 13+8 = 26$, which is more than half of 31. So the majority of people were less than 61 years old.
Answer:
There were 31 people at the party. There were children at the party. The majority of the people at the party were less than 61 years old.