an airline company uses the graph of the function to display the percent above or below the average price…
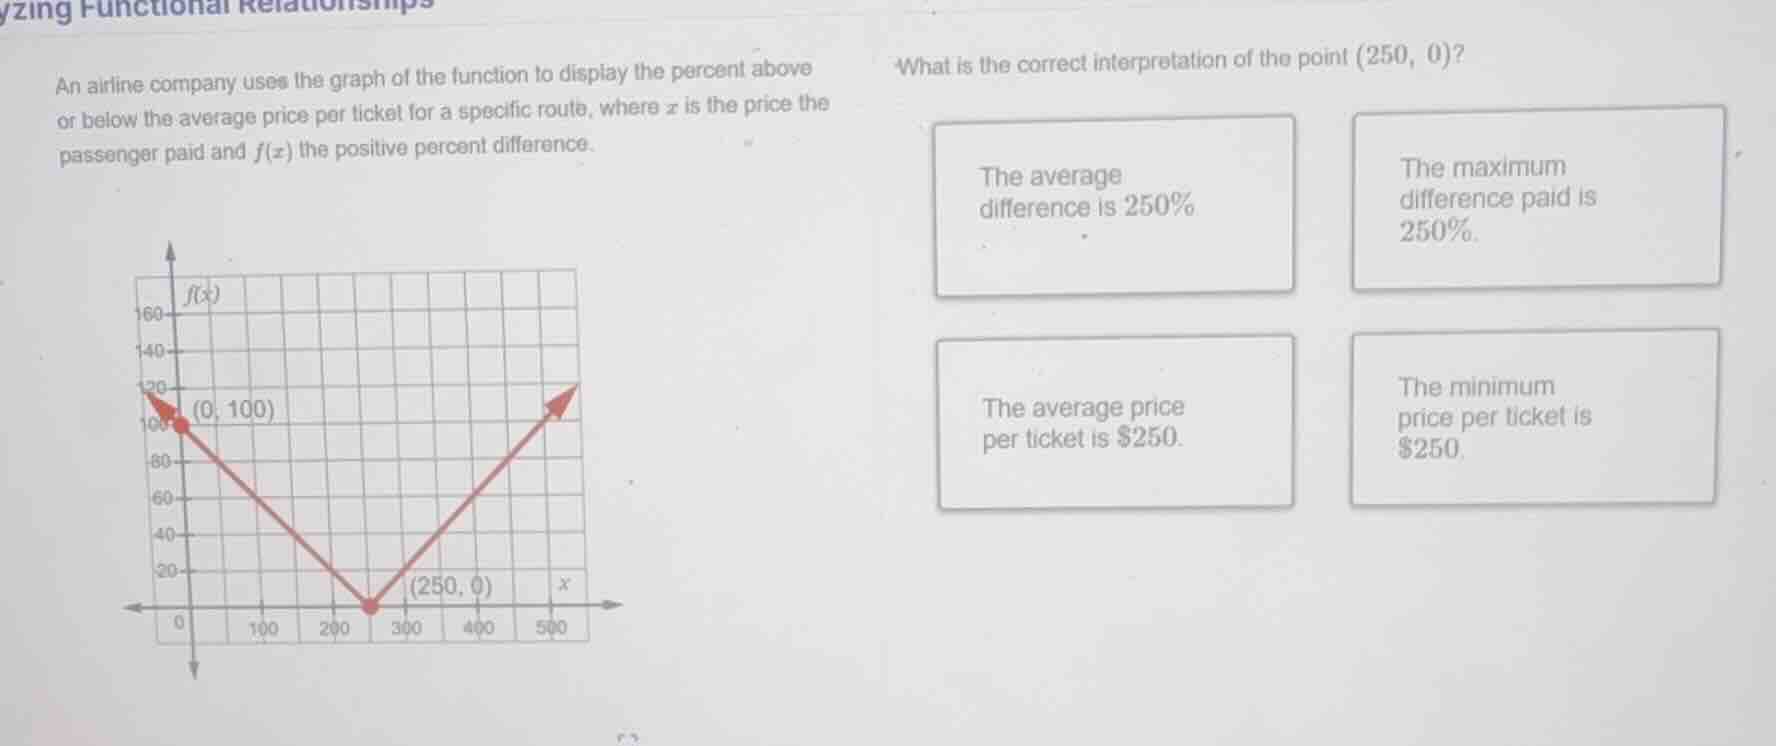
an airline company uses the graph of the function to display the percent above or below the average price per ticket for a specific route, where $x$ is the price the passenger paid and $f(x)$ the positive percent difference.\nwhat is the correct interpretation of the point $(250, 0)$?\nthe average difference is 250%\nthe maximum difference paid is 250%.\nthe average price per ticket is $250.\nthe minimum price per ticket is $250.
Answer
Brief Explanations:
The function (f(x)) represents the positive percent difference between the ticket price (x) a passenger paid and the average ticket price. When (f(x) = 0), it means there is 0% difference between the paid price and the average price. At the point ((250, 0)), (x = 250) (the paid price) and (f(x)=0), so this price equals the average ticket price.
Answer:
The average price per ticket is $250.