alyssa surveyed her classmates to determine how many miles they live from the school. the results are shown…
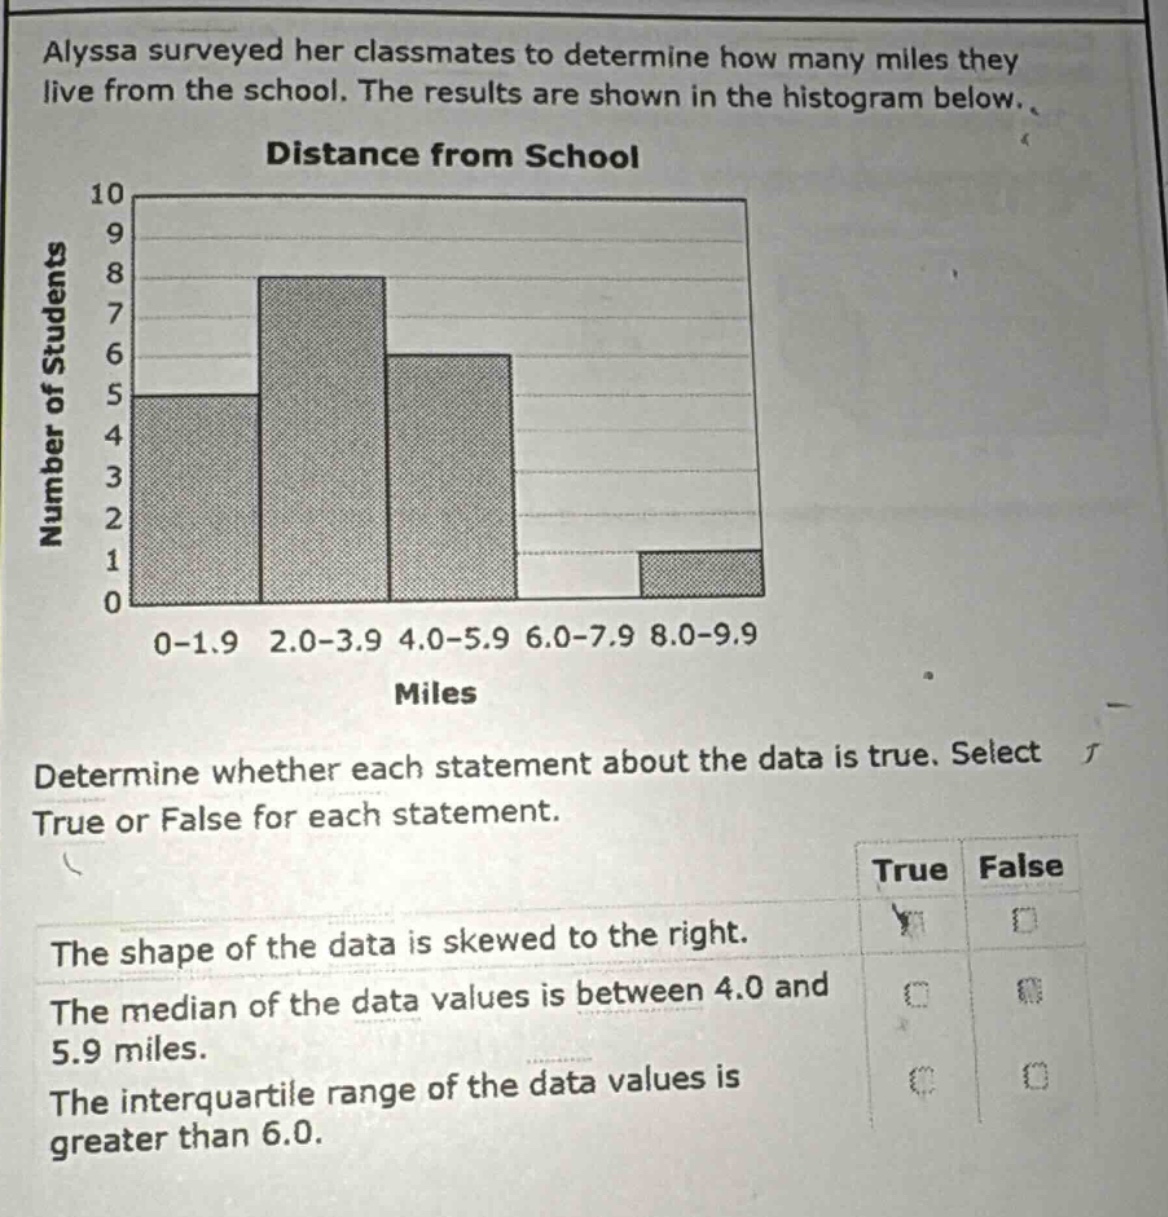
alyssa surveyed her classmates to determine how many miles they live from the school. the results are shown in the histogram below. distance from school determine whether each statement about the data is true. select true or false for each statement. the shape of the data is skewed to the right. the median of the data values is between 4.0 and 5.9 miles. the interquartile range of the data values is greater than 6.0.
Answer
Explanation:
Step1: Analyze data - shape
The higher frequencies are on the left - hand side and the tail extends to the right. So, the data is skewed to the right.
Step2: Calculate total number of data points
$5 + 8+6 + 0+1=20$ (an even number). The median is the average of the 10th and 11th ordered data points. Counting from the left, the 10th and 11th points fall in the $2.0 - 3.9$ range, not $4.0 - 5.9$.
Step3: Estimate quartiles
The first quartile ($Q_1$) is the median of the lower half of the data. The lower half has 10 data points, so $Q_1$ is the average of the 5th and 6th ordered data points, which is in the $2.0 - 3.9$ range. The third quartile ($Q_3$) is the median of the upper half of the data. The upper half has 10 data points, so $Q_3$ is the average of the 15th and 16th ordered data points, which is in the $4.0 - 5.9$ range. The inter - quartile range $IQR = Q_3 - Q_1$. The maximum value of $Q_3$ is 5.9 and the minimum value of $Q_1$ is 2.0, so $IQR\leqslant5.9 - 2.0=3.9<6.0$.
Answer:
The shape of the data is skewed to the right: True The median of the data values is between 4.0 and 5.9 miles: False The interquartile range of the data values is greater than 6.0: False