amber and chloe recorded the number of minutes they spent studying for ten days. their data are listed…
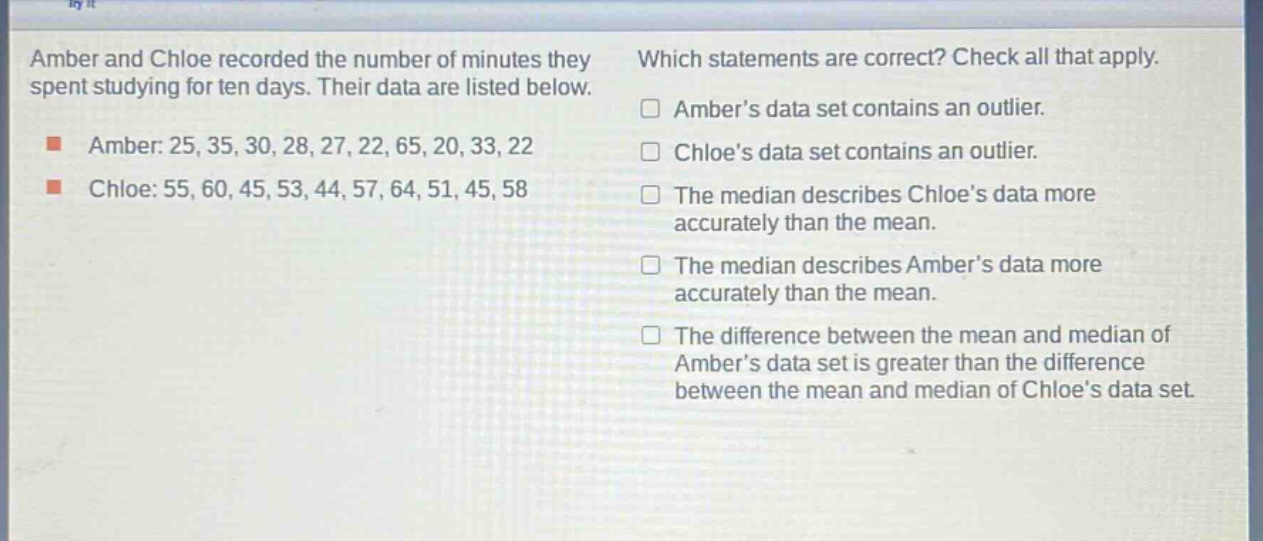
amber and chloe recorded the number of minutes they spent studying for ten days. their data are listed below.\namber: 25, 35, 30, 28, 27, 22, 65, 20, 33, 22\nchloe: 55, 60, 45, 53, 44, 57, 64, 51, 45, 58\nwhich statements are correct? check all that apply.\n□ amber’s data set contains an outlier.\n□ chloe’s data set contains an outlier.\n□ the median describes chloe’s data more accurately than the mean.\n□ the median describes amber’s data more accurately than the mean.\n□ the difference between the mean and median of amber’s data set is greater than the difference between the mean and median of chloe’s data set.
Answer
Explanation:
Step1: Arrange Amber's data in ascending order
20, 22, 22, 25, 27, 28, 30, 33, 35, 65
Step2: Calculate the quartiles for Amber's data
First, find the median (Q2) of Amber's data. Since (n = 10), the median is the average of the 5th and 6th - ordered values. (Q2=\frac{27 + 28}{2}=27.5). The lower - half of the data is 20, 22, 22, 25, 27. The median of the lower - half (Q1) is 22. The upper - half of the data is 28, 30, 33, 35, 65. The median of the upper - half (Q3) is 33. The inter - quartile range (IQR) for Amber's data is (IQR = Q3−Q1=33 - 22 = 11). The lower fence is (Q1-1.5\times IQR=22-1.5\times11=22 - 16.5 = 5.5). The upper fence is (Q3 + 1.5\times IQR=33+1.5\times11=33 + 16.5 = 49.5). Since 65>49.5, Amber's data set contains an outlier.
Step3: Arrange Chloe's data in ascending order
44, 45, 45, 51, 53, 55, 57, 58, 60, 64
Step4: Calculate the quartiles for Chloe's data
Since (n = 10), the median (Q2) is (\frac{53 + 55}{2}=54). The lower - half of the data is 44, 45, 45, 51, 53. The median of the lower - half (Q1) is 45. The upper - half of the data is 55, 57, 58, 60, 64. The median of the upper - half (Q3) is 58. The inter - quartile range (IQR) for Chloe's data is (IQR=Q3 - Q1=58 - 45 = 13). The lower fence is (Q1-1.5\times IQR=45-1.5\times13=45 - 19.5 = 25.5). The upper fence is (Q3 + 1.5\times IQR=58+1.5\times13=58 + 19.5 = 77.5). Since all data values are within the fences, Chloe's data set does not contain an outlier.
Step5: Analyze the effect of outliers on mean and median
For Amber's data, the mean (\bar{x}_A=\frac{25 + 35+30+28+27+22+65+20+33+22}{10}=\frac{287}{10}=28.7), and the median (M_A = 27.5). The difference is (|28.7 - 27.5|=1.2). For Chloe's data, the mean (\bar{x}_C=\frac{55 + 60+45+53+44+57+64+51+45+58}{10}=\frac{532}{10}=53.2), and the median (M_C = 54). The difference is (|53.2 - 54| = 0.8). Since Amber has an outlier, the median describes Amber's data more accurately than the mean. And the difference between the mean and median of Amber's data set is greater than the difference between the mean and median of Chloe's data set.
Answer:
Amber's data set contains an outlier. The median describes Amber's data more accurately than the mean. The difference between the mean and median of Amber's data set is greater than the difference between the mean and median of Chloe's data set.