an analyst is creating a graph to show the salaries of 200 employees. which type of graph would best display…
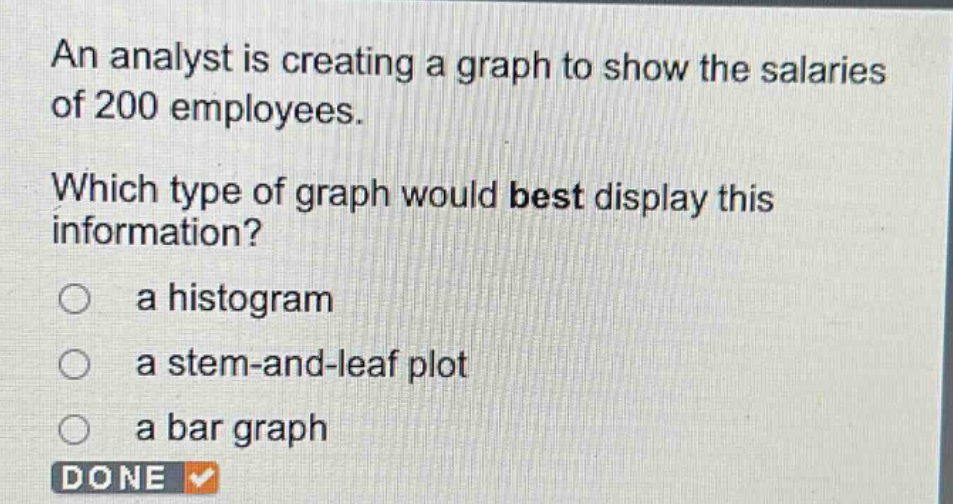
an analyst is creating a graph to show the salaries of 200 employees. which type of graph would best display this information? a histogram a stem - and - leaf plot a bar graph
Answer
Brief Explanations:
A histogram is ideal for showing the distribution of a large - set of continuous data like salaries. A stem - and - leaf plot is better for smaller data sets to show individual data values. A bar graph is used for comparing discrete categories, not for showing the distribution of a single continuous variable like salaries.
Answer:
a histogram