analyze the data represented in the graph and select the appropriate model. a exponential b linear c none d…
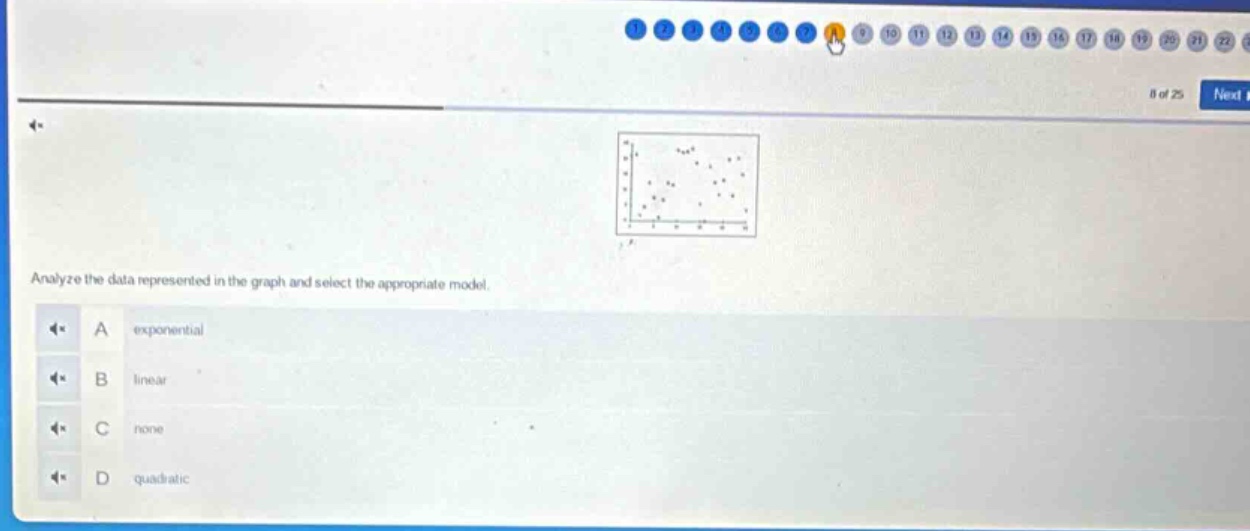
analyze the data represented in the graph and select the appropriate model. a exponential b linear c none d quadratic
Answer
Answer:
C. none
Explanation:
Step1: Observe data points
The data - points in the scatter - plot are randomly scattered.
Step2: Analyze model types
Exponential models have a characteristic curve shape, linear models have points that can be approximated by a straight line, and quadratic models have a parabolic shape. Since the points do not follow any of these patterns, the appropriate model is none.