analyze the histogram comparing the frequencies shown for the annual temperatures of kentucky and illinois…
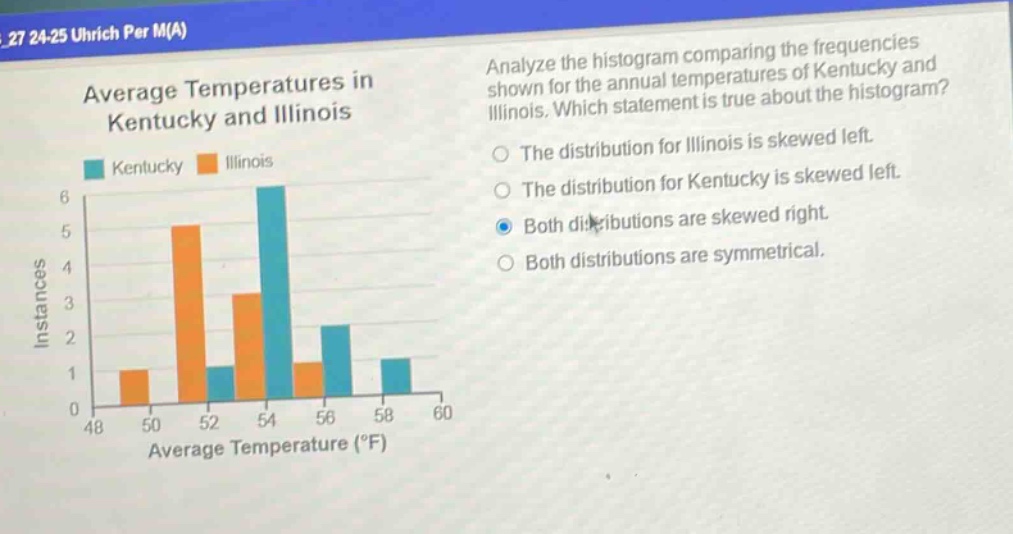
analyze the histogram comparing the frequencies shown for the annual temperatures of kentucky and illinois. which statement is true about the histogram? the distribution for illinois is skewed left. the distribution for kentucky is skewed left. both distributions are skewed right. both distributions are symmetrical.
Answer
Explanation:
Step1: Understand skewness
Skewed - left: tail on left side; skewed - right: tail on right side; symmetrical: evenly balanced.
Step2: Examine Kentucky's distribution
For Kentucky, the bars decrease from 54 - 56°F towards higher temperatures, with a long tail on the right.
Step3: Examine Illinois's distribution
For Illinois, the bars decrease from 50 - 52°F towards higher temperatures, with a long tail on the right.
Answer:
Both distributions are skewed right.