analyze the scatterplot graph. age vs. weight which trend does the graph show? as age increases, weight…
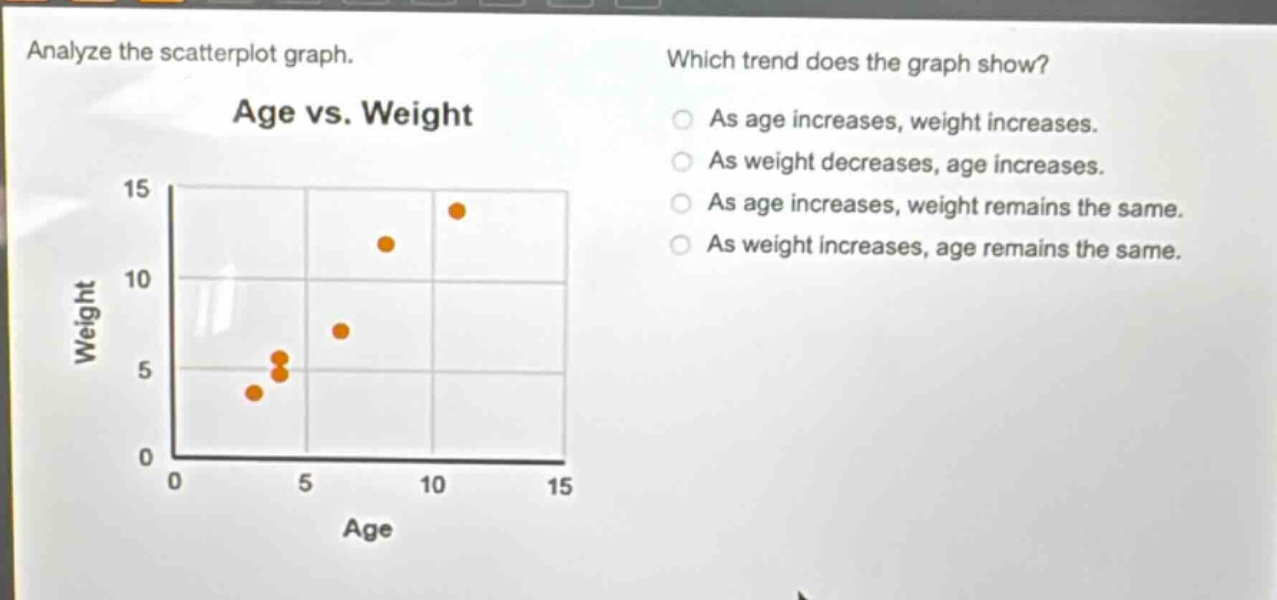
analyze the scatterplot graph. age vs. weight which trend does the graph show? as age increases, weight increases. as weight decreases, age increases. as age increases, weight remains the same. as weight increases, age remains the same.
Answer
Answer:
As age increases, weight increases.
Explanation:
Step1: Observe scatter - plot points
As age values on x - axis increase from 0 to 15, weight values on y - axis also generally increase from around 0 to 15.