analyzing a scatterplot\nidentify the level of association and correlation in the scatterplot.\nstrong…
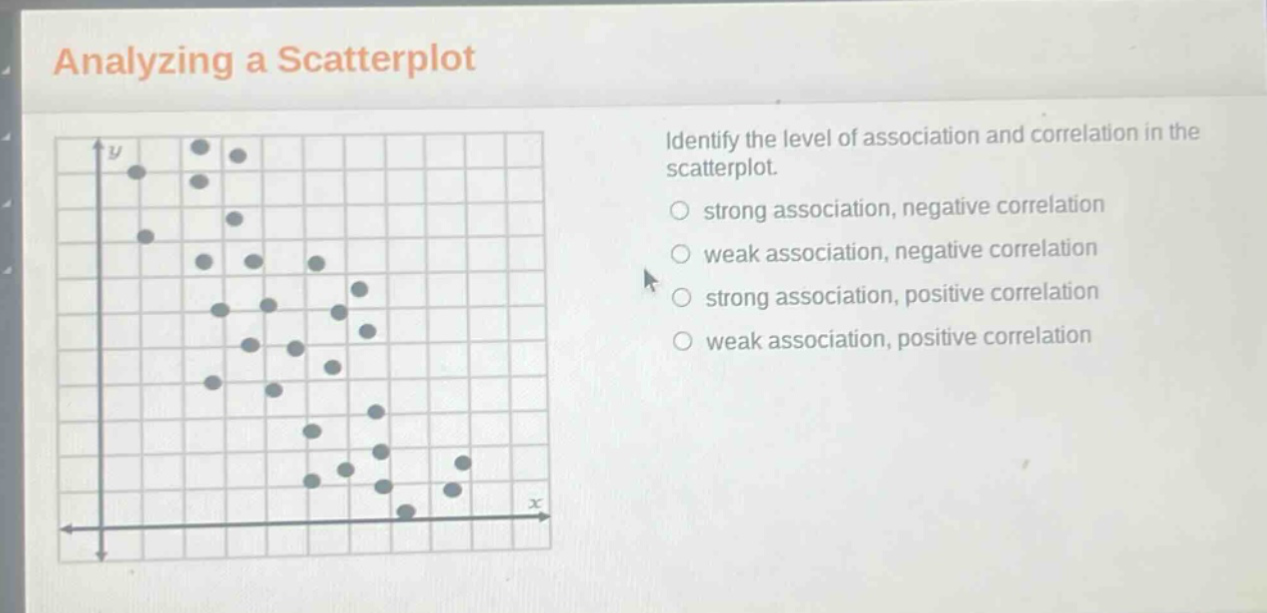
analyzing a scatterplot\nidentify the level of association and correlation in the scatterplot.\nstrong association, negative correlation\nweak association, negative correlation\nstrong association, positive correlation\nweak association, positive correlation
Answer
Explanation:
Step1: Observe data - point spread
If the data - points are closely clustered around a line, it is a strong association. If they are widely scattered, it is a weak association. Here, the points are widely scattered, so it is a weak association.
Step2: Check slope direction
If as (x) increases, (y) increases, it is a positive correlation. If as (x) increases, (y) decreases, it is a negative correlation. Here, as (x) increases, (y) generally decreases, so it is a negative correlation.
Answer:
weak association, negative correlation