andy is trying to determine the correlation between the number of math homework assignments he completes and…
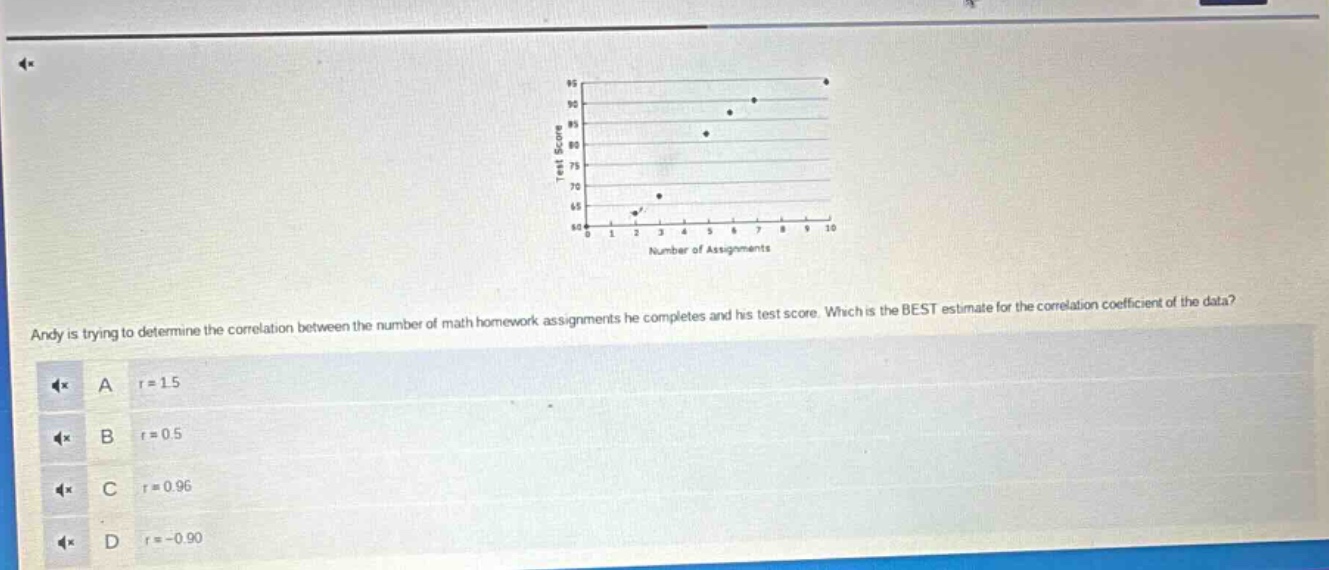
andy is trying to determine the correlation between the number of math homework assignments he completes and his test score. which is the best estimate for the correlation coefficient of the data? a r = 1.5 b r = 0.5 c r = 0.96 d r = - 0.90
Answer
Answer:
C. $r = 0.96$
Explanation:
Step1: Observe the scatter - plot
The points in the scatter - plot show a strong positive linear relationship. As the number of assignments increases, the test score also increases.
Step2: Recall correlation coefficient range
The correlation coefficient $r$ ranges from - 1 to 1. A value close to 1 indicates a strong positive linear relationship, a value close to - 1 indicates a strong negative linear relationship, and a value close to 0 indicates a weak or no linear relationship.
Step3: Eliminate incorrect options
Option A: $r = 1.5$ is out of the range of the correlation coefficient (-1 $\leq r\leq$ 1), so it is incorrect. Option B: $r = 0.5$ represents a moderate positive relationship, but the scatter - plot shows a very strong positive relationship. Option D: $r=-0.90$ represents a strong negative relationship, which is not what the scatter - plot shows. Option C: $r = 0.96$ is close to 1 and represents a strong positive linear relationship, which is consistent with the scatter - plot.