anja collected data about the number of dogs 9th - grade students own. she created this histogram to…
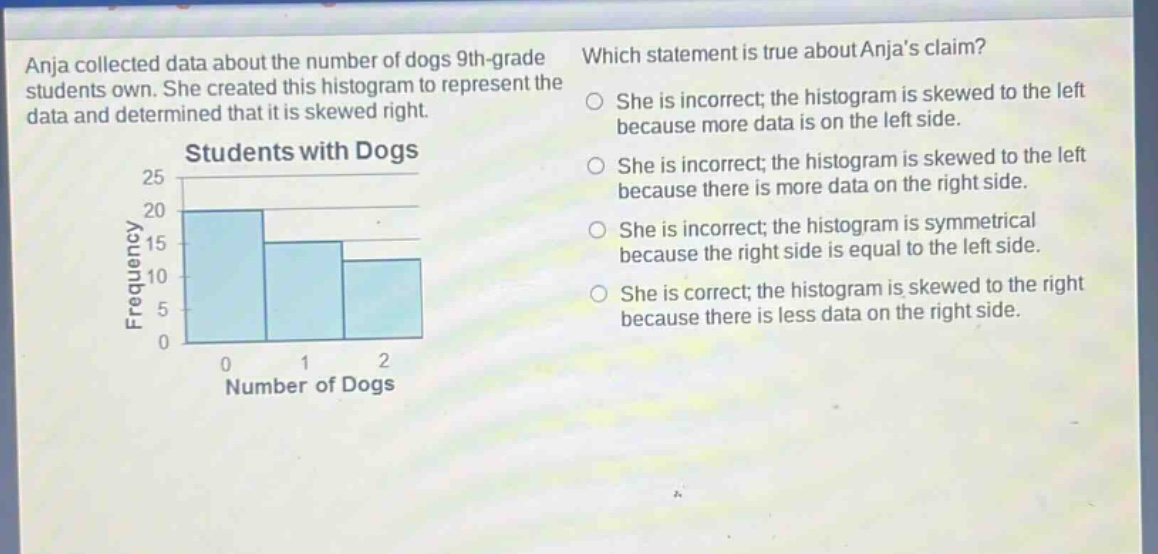
anja collected data about the number of dogs 9th - grade students own. she created this histogram to represent the data and determined that it is skewed right. which statement is true about anjas claim? she is incorrect; the histogram is skewed to the left because more data is on the left side. she is incorrect; the histogram is skewed to the left because there is more data on the right side. she is incorrect; the histogram is symmetrical because the right side is equal to the left side. she is correct; the histogram is skewed to the right because there is less data on the right side.
Answer
Explanation:
Step1: Understand skewness concept
In a right - skewed distribution, the tail is on the right side and there is less data on the right side. In a left - skewed distribution, the tail is on the left side and there is less data on the left side. A symmetrical distribution has equal data on both sides.
Step2: Analyze the histogram
Looking at the histogram of students with dogs, the frequency of students with 0 dogs is 20, with 1 dog is 15, and with 2 dogs is 10. The frequencies decrease as the number of dogs increases. There is less data on the right side (higher number of dogs).
Answer:
She is correct; the histogram is skewed to the right because there is less data on the right side.