annaleigh looked at a line graph to see the amount of rainfall over the entire year. why did she choose a…
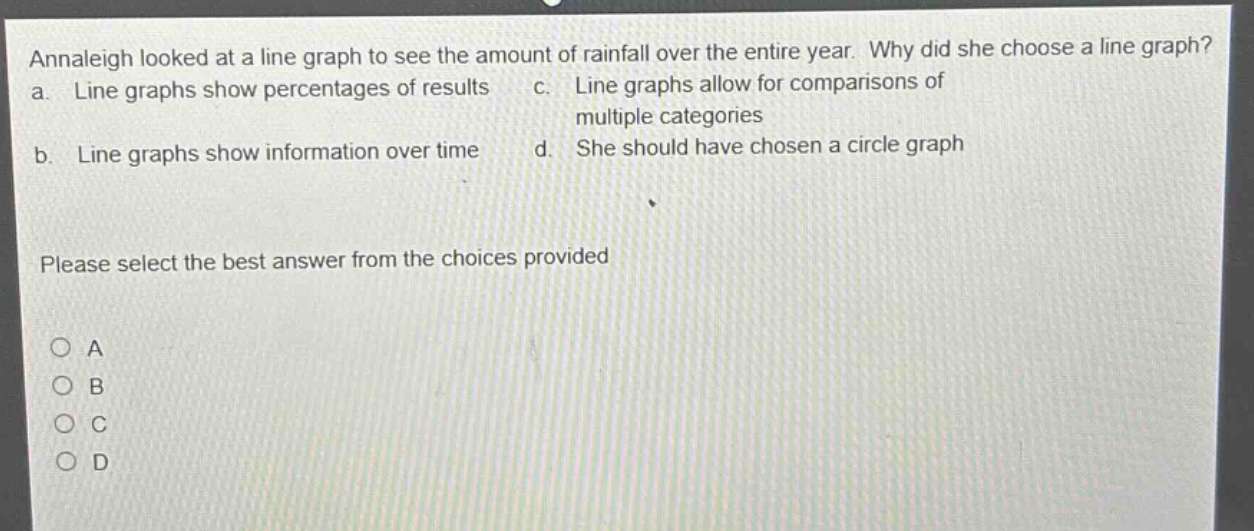
annaleigh looked at a line graph to see the amount of rainfall over the entire year. why did she choose a line graph? a. line graphs show percentages of results c. line graphs allow for comparisons of multiple categories b. line graphs show information over time d. she should have chosen a circle graph please select the best answer from the choices provided o a o b o c o d
Answer
Brief Explanations:
Line graphs are ideal for showing trends over time. Since Annaleigh wants to see rainfall amounts over a year (a time - based period), this is the key reason for her choice. Pie charts (circle graphs) show proportions of a whole, not time - based data.
Answer:
B. Line graphs show information over time