answer the following.\n(a) the standard normal curve is graphed below. shade the region under the standard…
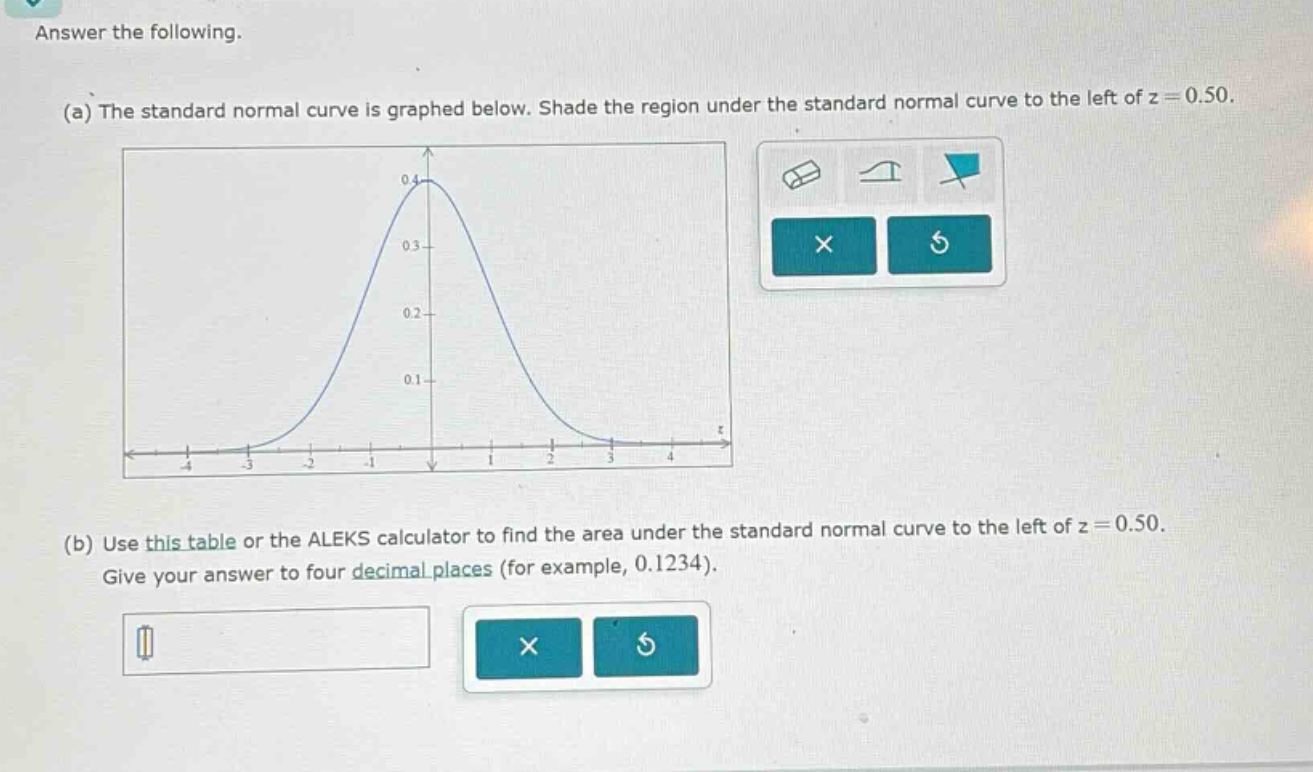
answer the following.\n(a) the standard normal curve is graphed below. shade the region under the standard normal curve to the left of z = 0.50.\n(b) use this table or the aleks calculator to find the area under the standard normal curve to the left of z = 0.50. give your answer to four decimal places (for example, 0.1234).
Answer
Explanation:
Step1: Understand the problem
Find cumulative probability for ( z = 0.50 ).
Step2: Use standard normal table
Locate row ( 0.5 ) and column ( 0.00 ), value is ( 0.6915 ).
Answer:
0.6915