answer the statistical measures and create a box and whiskers plot for the following set of data…
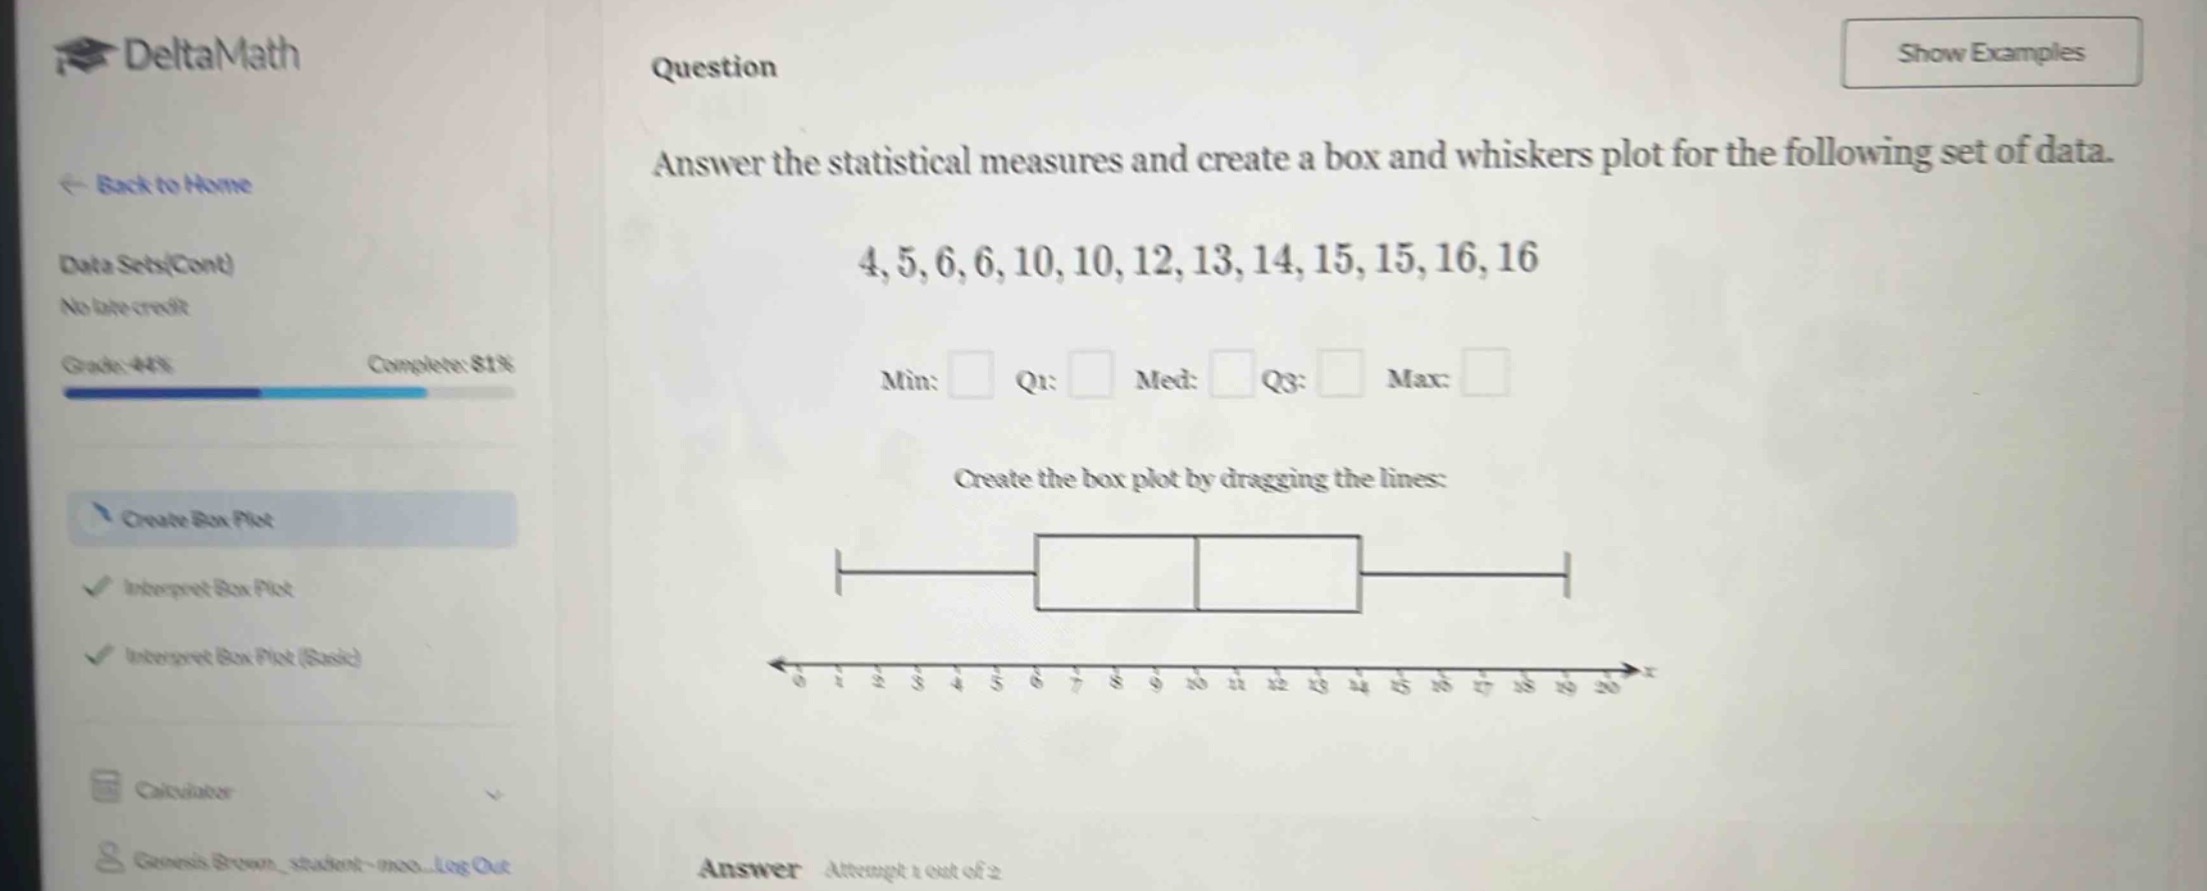
answer the statistical measures and create a box and whiskers plot for the following set of data. 4,5,6,6,10,10,12,13,14,15,15,16,16 min: q1: med: q3: max: create the box plot by dragging the lines:
Answer
Explanation:
Step1: Find the minimum value
The minimum value in the data - set $4,5,6,6,10,10,12,13,14,15,15,16,16$ is $4$.
Step2: Find the maximum value
The maximum value in the data - set is $16$.
Step3: Find the median (Med)
There are $n = 13$ data points. The median is the $\left(\frac{n + 1}{2}\right)$-th value. $\frac{13+1}{2}=7$ - th value. So, the median (Med) is $12$.
Step4: Find the lower half of the data
The lower half of the data is $4,5,6,6,10,10$.
Step5: Find the first quartile (Q1)
There are $n_1=6$ data points in the lower - half. The first quartile is the median of the lower - half. Since $n_1 = 6$ (an even number), the median of the lower - half is $\frac{6 + 6}{2}=6$. So, Q1 = 6.
Step6: Find the upper half of the data
The upper half of the data is $13,14,15,15,16,16$.
Step7: Find the third quartile (Q3)
There are $n_2 = 6$ data points in the upper - half. The third quartile is the median of the upper - half. Since $n_2=6$ (an even number), the median of the upper - half is $\frac{15 + 15}{2}=15$. So, Q3 = 15.
Answer:
Min: 4 Q1: 6 Med: 12 Q3: 15 Max: 16