the most appropriate measure of center for this data is the median. complete which statement about the data…
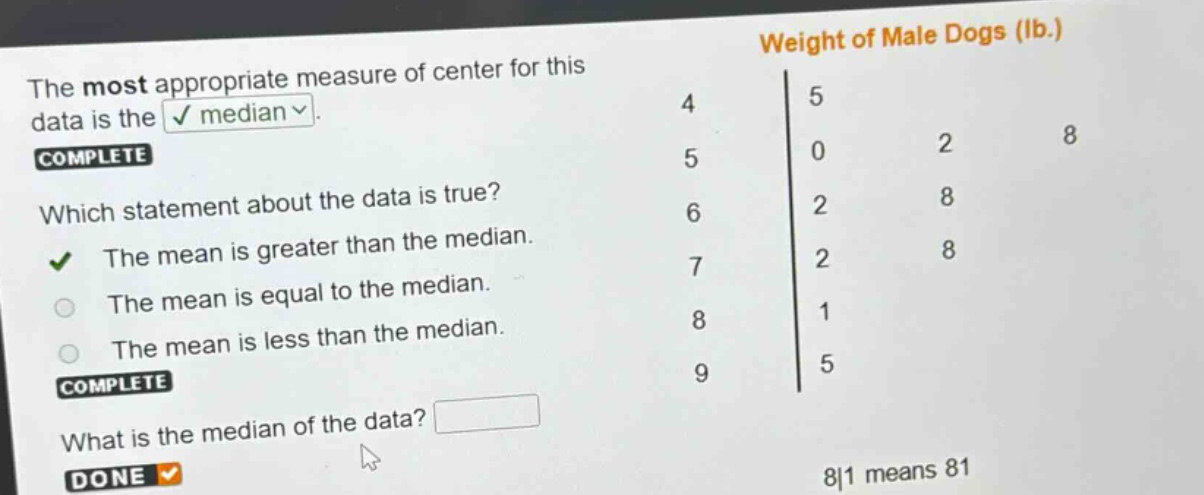
the most appropriate measure of center for this data is the median. complete which statement about the data is true? the mean is greater than the median. the mean is equal to the median. the mean is less than the median. complete what is the median of the data? done 8|1 means 81 weight of male dogs (lb.) 4 5 5 0 2 8 6 2 8 7 2 8 8 1 9 5
Answer
Answer:
65
Explanation:
Step1: Write out the data set
The data set from the stem - and - leaf plot is: 45, 50, 52, 58, 62, 68, 72, 78, 81, 95.
Step2: Determine the number of data points
There are $n = 10$ data points.
Step3: Calculate the median position
For a data set with $n$ data points (where $n$ is even), the median is the average of the $\frac{n}{2}$th and $(\frac{n}{2}+ 1)$th ordered data points. Here, $\frac{n}{2}=\frac{10}{2}=5$ and $\frac{n}{2}+1 = 6$.
Step4: Find the median
The 5th value is 62 and the 6th value is 68. The median is $\frac{62 + 68}{2}=\frac{130}{2}=65$.