the approximate line of best fit for the given data points, y = -2x - 2, is shown on the graph. which is the…
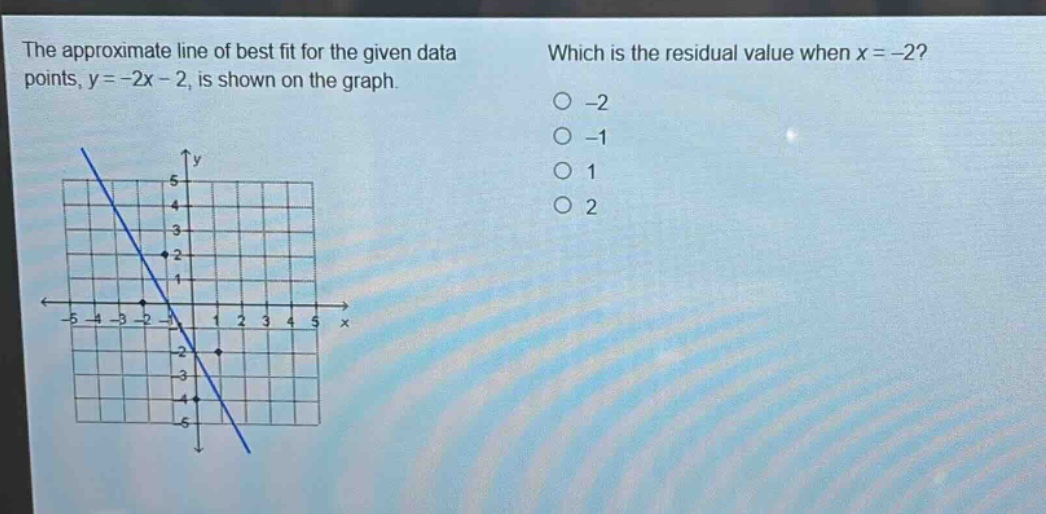
the approximate line of best fit for the given data points, y = -2x - 2, is shown on the graph. which is the residual value when x = -2? -2 -1 1 2
Answer
Explanation:
Step1: Find predicted value
Substitute $x = - 2$ into $y=-2x - 2$. $y=-2\times(-2)-2=4 - 2=2$
Step2: Determine actual value from graph
From the graph, when $x=-2$, the actual $y -$value is $1$.
Step3: Calculate residual
Residual = Actual value - Predicted value. Residual=$1 - 2=-1$
Answer:
-1