which could be the approximate value of the correlation coefficient for the accompanying scatter plot? -0.85…
which could be the approximate value of the correlation coefficient for the accompanying scatter plot? -0.85 0.21 -0.16 0.91
Answer
Explanation:
Step1: Analyze scatter - plot direction
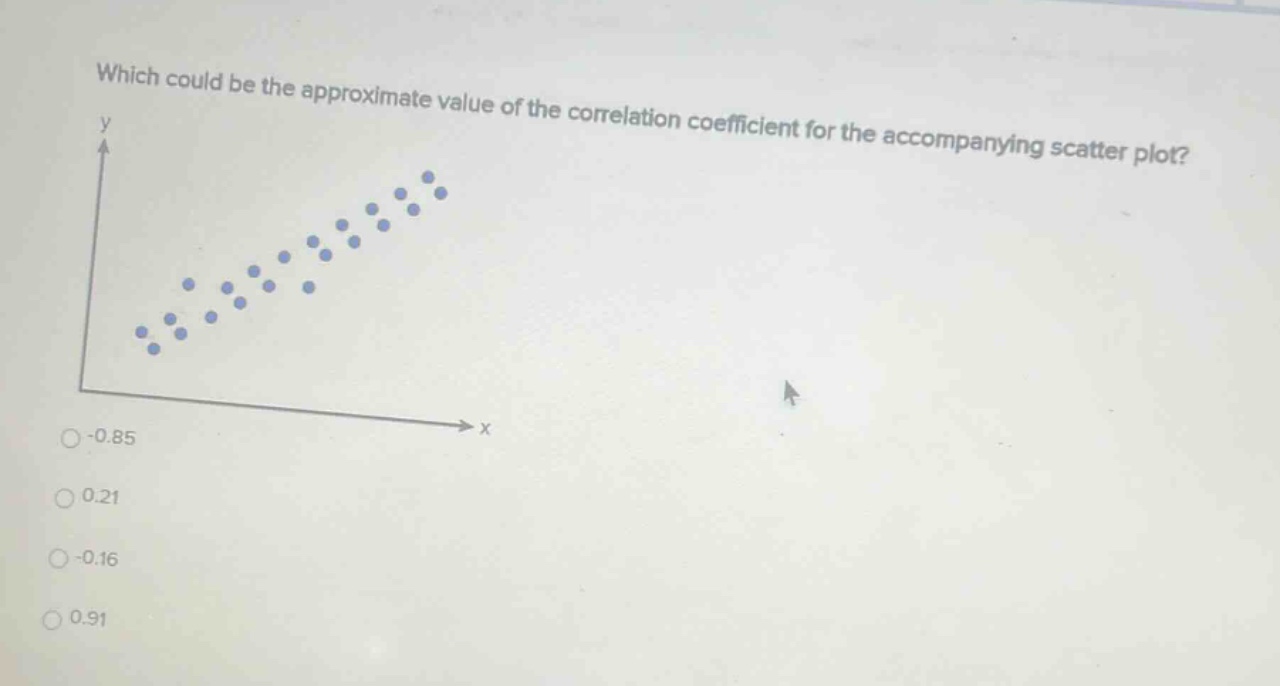
The points in the scatter - plot are going upwards from left to right, indicating a positive linear relationship. So the correlation coefficient $r>0$. This eliminates the options - 0.85 and - 0.16.
Step2: Analyze scatter - plot tightness
The points are closely clustered around a line, which means the linear relationship is strong. A value of $r = 0.21$ represents a weak positive correlation, while a value of $r=0.91$ represents a strong positive correlation. Since the points are tightly grouped, the correlation coefficient is close to 1.
Answer:
0.91