an article reported the ages of 12 ceos: the approximate location of the median is point a/b/c the…
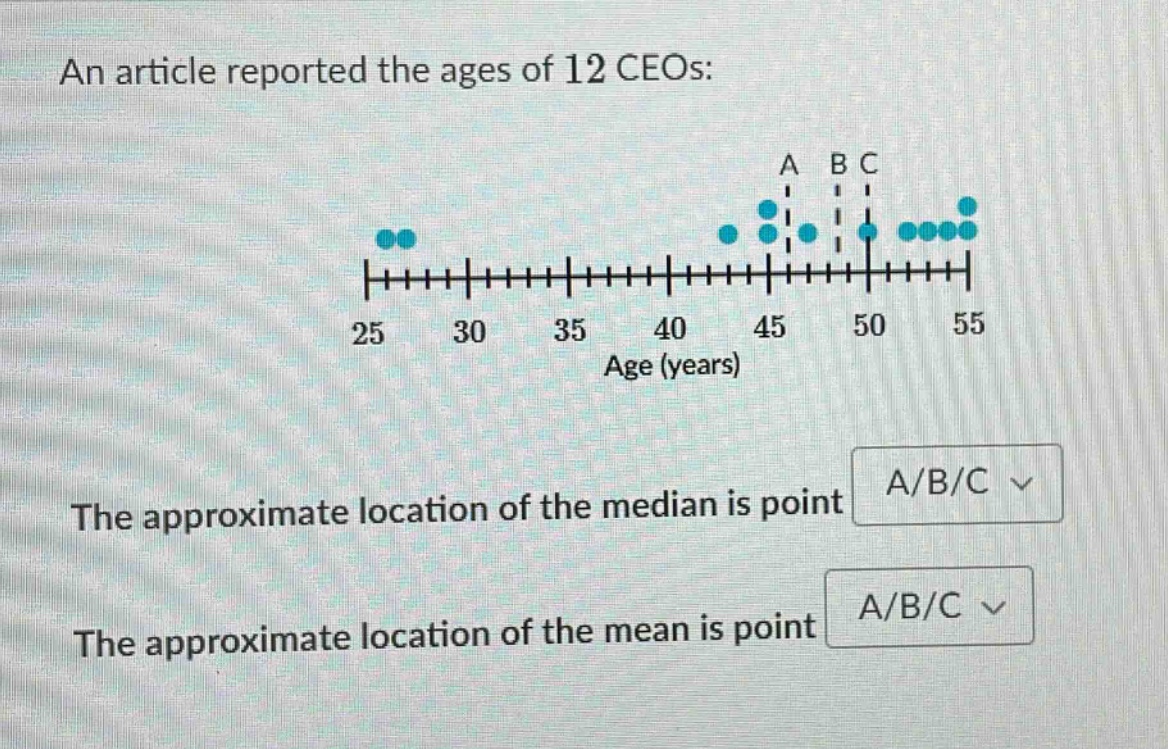
an article reported the ages of 12 ceos: the approximate location of the median is point a/b/c the approximate location of the mean is point a/b/c
Answer
Explanation:
Step1: Find position of median
For $n = 12$ (even - numbered data set), median is average of $\frac{n}{2}$ and $\frac{n}{2}+1$ ordered values. $\frac{n}{2}=\frac{12}{2}=6$ and $\frac{n}{2}+1 = 7$. We order the data points from the dot - plot and find the average of the 6th and 7th values. Counting the dots from left to right, the 6th and 7th values fall around point B.
Step2: Estimate the mean
The mean is the sum of all values divided by the number of values. There are some lower - value data points on the left side (25 - 30 range) and more higher - value data points on the right side (45 - 55 range). The higher values will pull the mean to the right of the median. So the mean is around point C.
Answer:
The approximate location of the median is point B. The approximate location of the mean is point C.