assume that a randomly selected subject is given a bone density test. those test scores are normally…
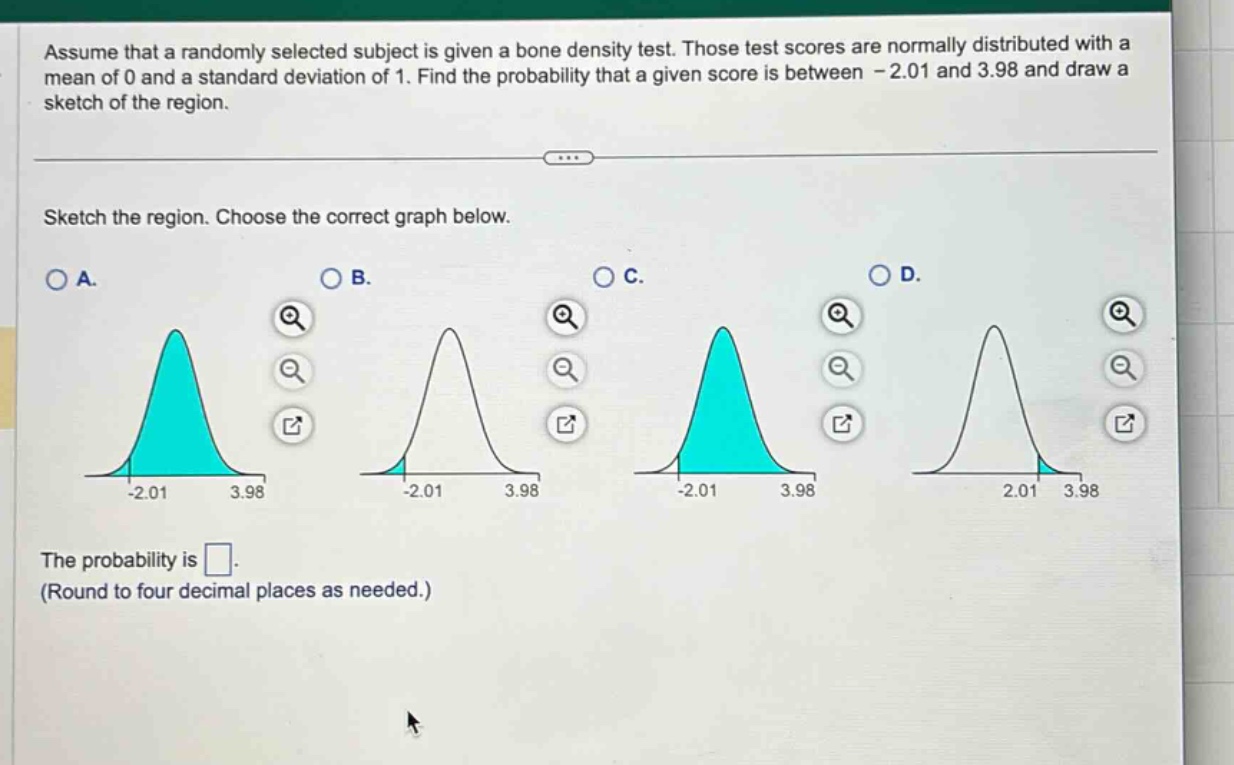
assume that a randomly selected subject is given a bone density test. those test scores are normally distributed with a mean of 0 and a standard deviation of 1. find the probability that a given score is between - 2.01 and 3.98 and draw a sketch of the region. sketch the region. choose the correct graph below. a. b. c. d. the probability is. (round to four decimal places as needed.)
Answer
Explanation:
Step1: Recall the properties of standard - normal distribution
We know that if (Z) is a standard - normal random variable ((Z\sim N(0,1))), and we want to find (P(-2.01<Z<3.98)). We use the property (P(a < Z < b)=P(Z < b)-P(Z < a)).
Step2: Use the standard - normal table
The standard - normal table gives the cumulative distribution function values of (Z). From the standard - normal table, (P(Z < - 2.01)=0.0222) and (P(Z < 3.98)\approx1) (since for (z = 3.98), the area to the left is very close to 1 in the standard - normal distribution).
Step3: Calculate the probability
[P(-2.01<Z<3.98)=P(Z < 3.98)-P(Z < - 2.01)=1 - 0.0222=0.9778]
Answer:
0.9778
The correct graph is A as it shows the area between (z=-2.01) and (z = 3.98) shaded under the standard - normal curve.