aubrey recorded the low temperature in her home town each day for two weeks. her results, in degrees…
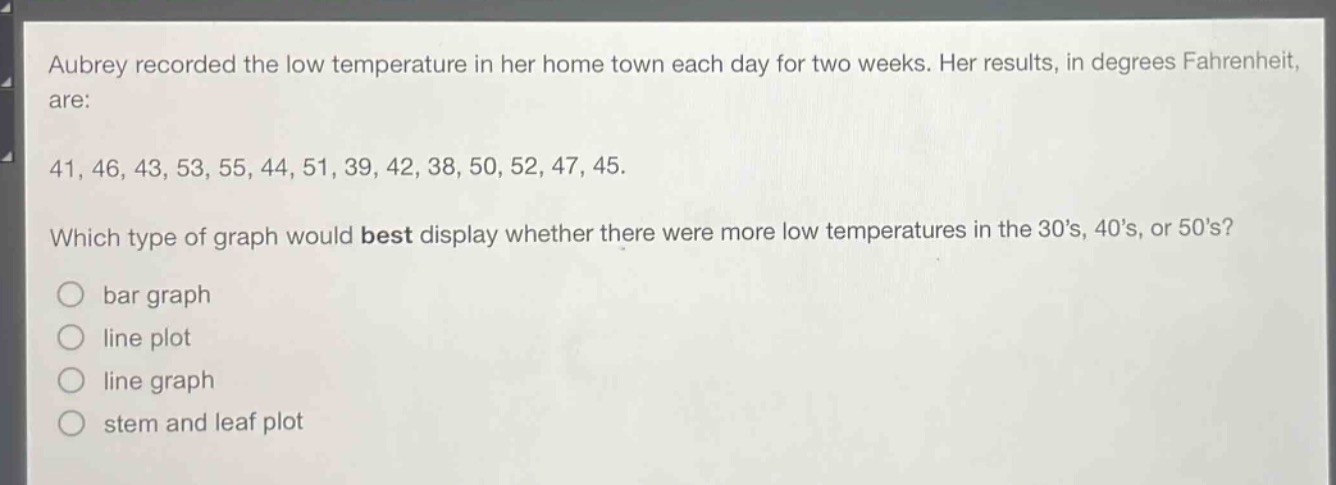
aubrey recorded the low temperature in her home town each day for two weeks. her results, in degrees fahrenheit, are: 41, 46, 43, 53, 55, 44, 51, 39, 42, 38, 50, 52, 47, 45. which type of graph would best display whether there were more low temperatures in the 30’s, 40’s, or 50’s? bar graph line plot line graph stem and leaf plot
Answer
Brief Explanations:
A stem - and - leaf plot organizes data by showing the distribution of data values. It can easily group the temperatures into the 30s, 40s, and 50s and display the frequency of values in each group. A bar graph is better for comparing discrete categories that may not have an inherent order in the way these temperature ranges do. A line plot is more for showing the frequency of individual data points on a number line. A line graph is used to show trends over time.
Answer:
stem and leaf plot