austin has a part - time job at an ice skating rink selling hot cocoa. he decided to plot the number of hot…
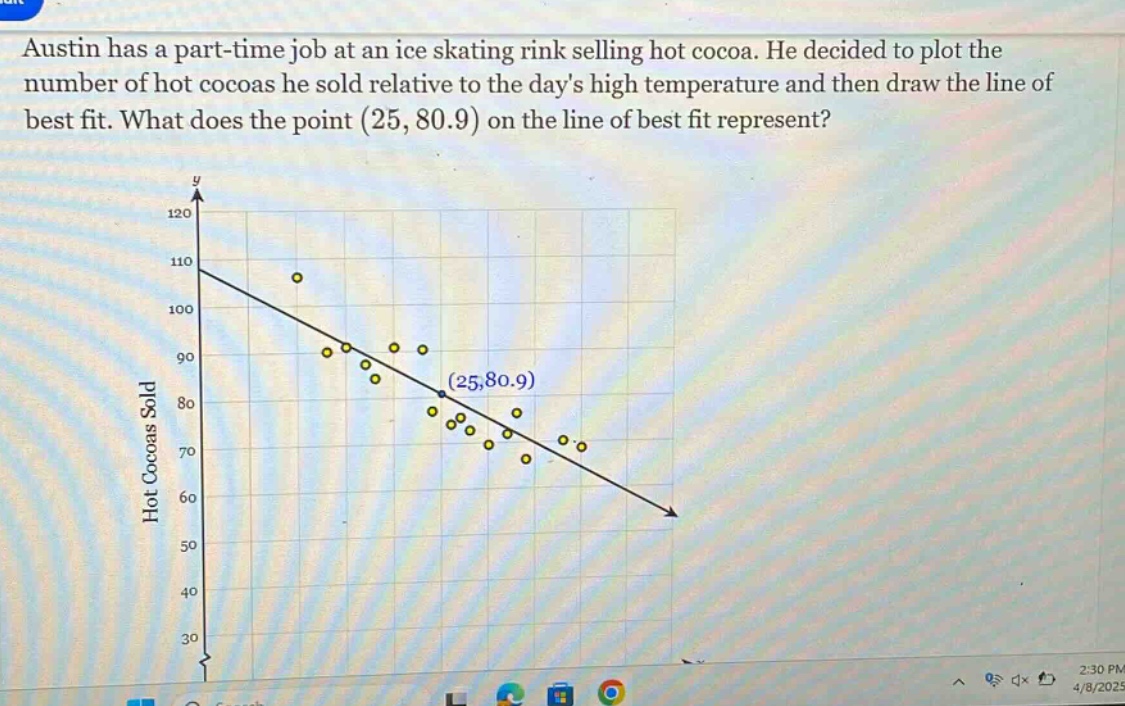
austin has a part - time job at an ice skating rink selling hot cocoa. he decided to plot the number of hot cocoas he sold relative to the days high temperature and then draw the line of best fit. what does the point (25, 80.9) on the line of best fit represent?
Answer
Brief Explanations:
In a scatter - plot with a line of best fit where the x - axis represents the day's high temperature and the y - axis represents the number of hot cocoas sold, a point (x, y) gives the relationship between temperature and sales. Here, x = 25 and y = 80.9.
Answer:
When the day's high temperature is 25 degrees, the predicted number of hot cocoas sold is 80.9.