autumns math teacher plots student grades on their weekly quizzes against the number of hours they say they…
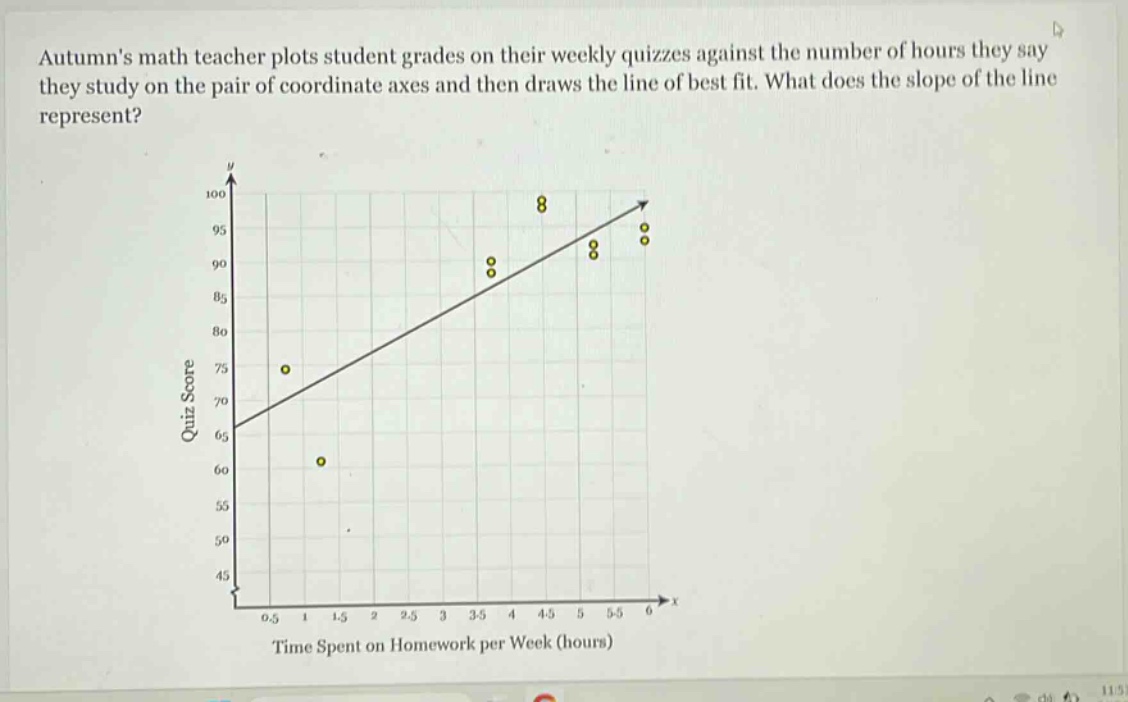
autumns math teacher plots student grades on their weekly quizzes against the number of hours they say they study on the pair of coordinate axes and then draws the line of best fit. what does the slope of the line represent?
Answer
Explanation:
Step1: Recall the formula for slope
Slope formula is (m = \frac{\Delta y}{\Delta x}). In this context, (y) - axis represents quiz scores and (x) - axis represents time spent on homework.
Step2: Interpret (\Delta y) and (\Delta x)
(\Delta y) is the change in quiz score and (\Delta x) is the change in time spent on homework.
Answer:
The slope represents the change in quiz score per unit change in the time spent on homework (i.e., the average increase in quiz score for each additional hour spent on homework).