the average age of the children at a campout is shown in the box plot below. which statement is true about…
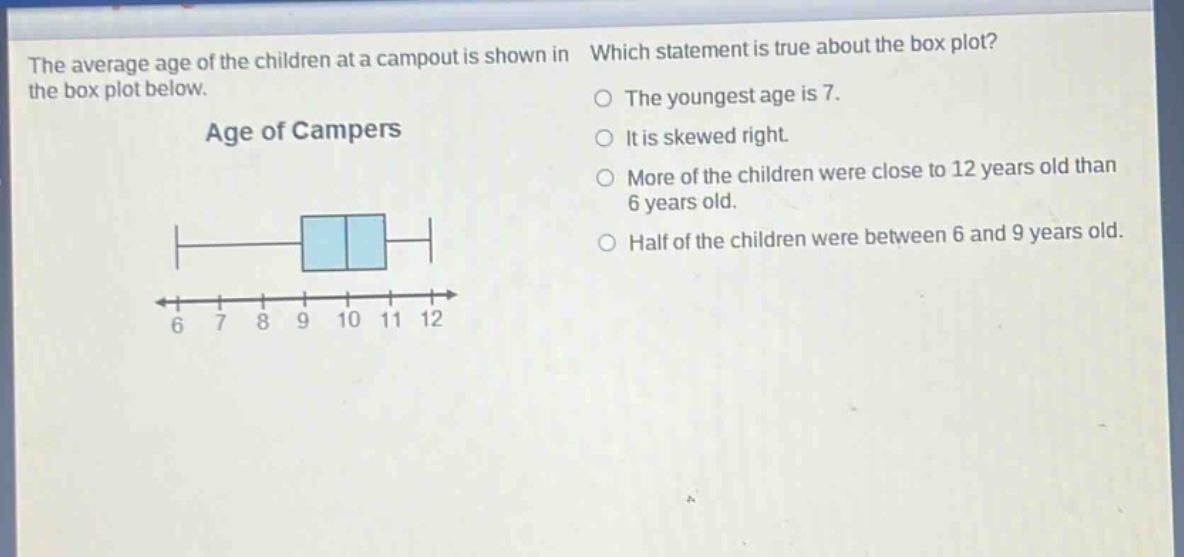
the average age of the children at a campout is shown in the box plot below. which statement is true about the box plot? age of campers the youngest age is 7. it is skewed right. more of the children were close to 12 years old than 6 years old. half of the children were between 6 and 9 years old. 6 7 8 9 10 11 12
Answer
Explanation:
Step1: Analyze box - plot properties
In a box - plot, the left - most whisker represents the minimum value. Here, the minimum value is 6, not 7. So the statement "The youngest age is 7" is false.
Step2: Check for skewness
The box is symmetrically placed between the whiskers, so it is not skewed right.
Step3: Analyze data distribution
There is no indication from the box - plot that more children were close to 12 years old than 6 years old.
Step4: Recall box - plot quartile property
The box in a box - plot represents the inter - quartile range (IQR), which contains 50% of the data. Here, the box ranges from 6 to 9, so half of the children were between 6 and 9 years old.
Answer:
Half of the children were between 6 and 9 years old.