the average age of the children at a campout is shown in the box plot below. which statement is true about…
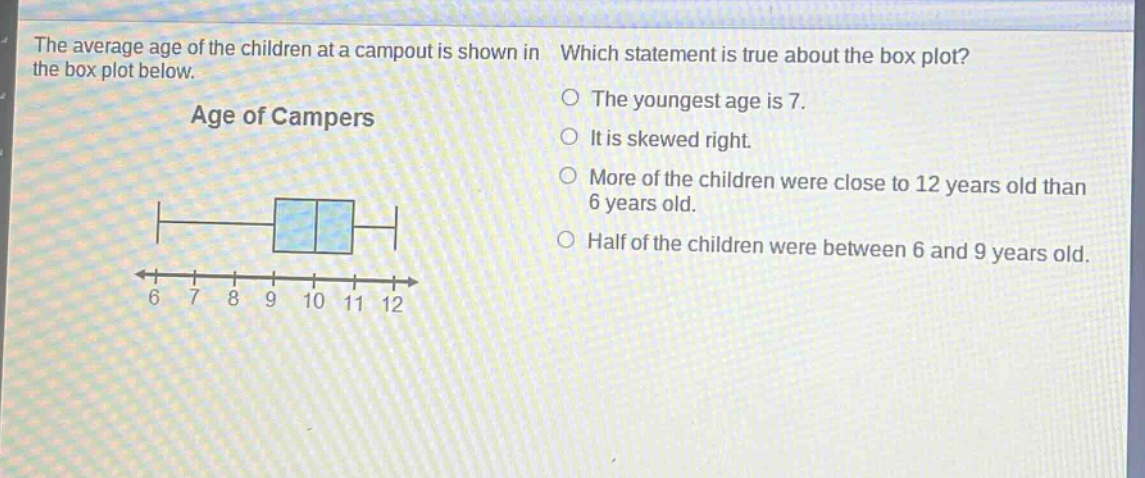
the average age of the children at a campout is shown in the box plot below. which statement is true about the box plot? age of campers o the youngest age is 7. o it is skewed right. o more of the children were close to 12 years old than 6 years old. o half of the children were between 6 and 9 years old. 6 7 8 9 10 11 12
Answer
Answer:
D. Half of the children were between 6 and 9 years old.
Explanation:
Step1: Recall box - plot properties
In a box - plot, the box represents the inter - quartile range (IQR). The lower end of the box is the first quartile ($Q_1$) and the upper end is the third quartile ($Q_3$). The data between $Q_1$ and $Q_3$ represents 50% of the data.
Step2: Analyze the box - plot
In the given box - plot, the lower end of the box is at 6 and the upper end is at 9. So, 50% (half) of the children were between 6 and 9 years old.
Step3: Analyze other options
- Option A: The youngest age (minimum value) is less than 6, not 7.
- Option B: The box - plot is symmetric as the median is in the middle of the box and the whiskers are of similar length on both sides, so it is not skewed right.
- Option C: There is no indication from the box - plot that more children were close to 12 years old than 6 years old.