the average high temperatures in san antonio, tx for several months are shown in the table. make a scatter…
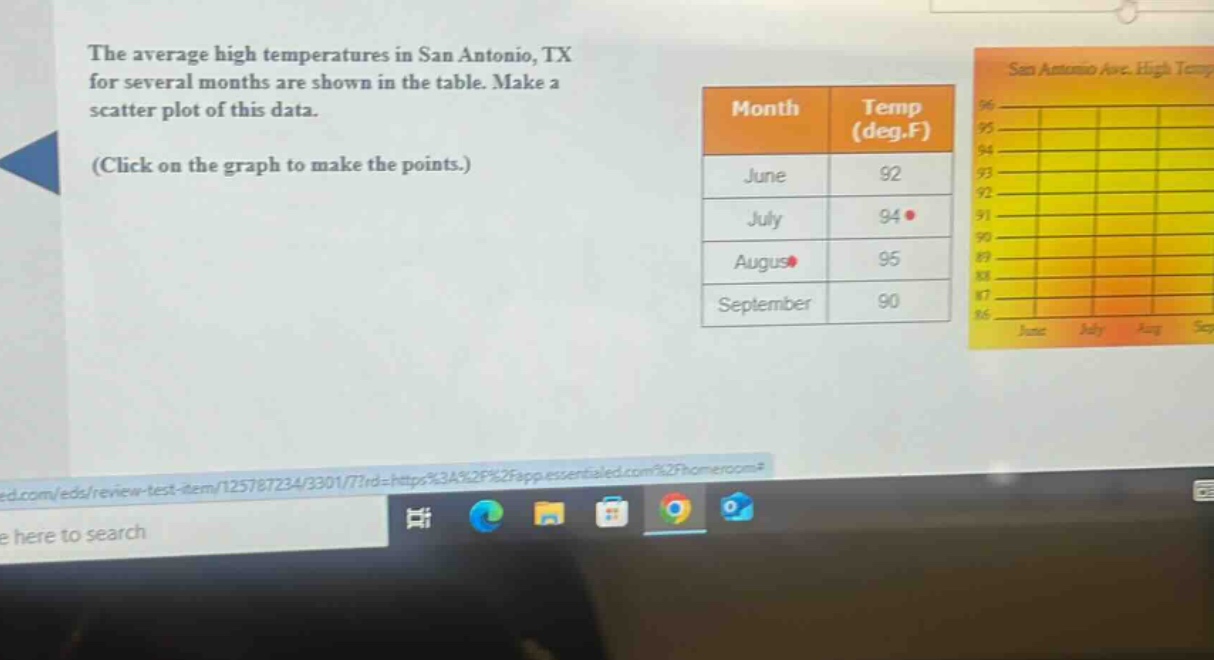
the average high temperatures in san antonio, tx for several months are shown in the table. make a scatter plot of this data. (click on the graph to make the points.)
Answer
Explanation:
Step1: Identify x - and y - variables
Let the months (June, July, August, September) be on the x - axis and the temperatures (in deg.F) be on the y - axis.
Step2: Locate points
For June, the x - value is "June" and y - value is 92. Plot the point (June, 92). For July, x - value is "July" and y - value is 94. Plot the point (July, 94). For August, x - value is "August" and y - value is 95. Plot the point (August, 95). For September, x - value is "September" and y - value is 90. Plot the point (September, 90).
Since this is an instruction to create a scatter - plot and not a numerical answer, the steps above describe the process. In a real - world scenario using a graphing tool, you would follow these steps to place the points on the graph.