the average monthly amount isabella has spent on gasoline since 1990 is shown in the table.\n| year |…
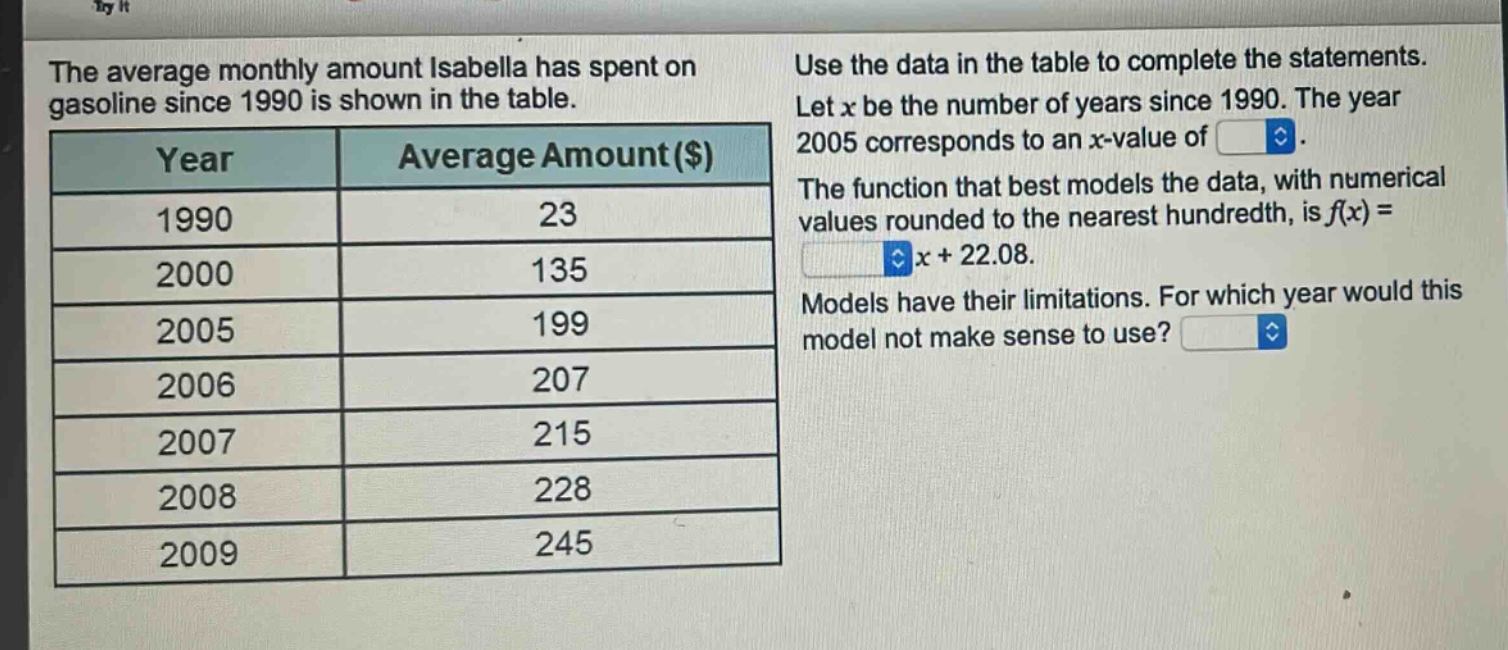
the average monthly amount isabella has spent on gasoline since 1990 is shown in the table.\n| year | average amount($) |\n| ---- | ---- |\n| 1990 | 23 |\n| 2000 | 135 |\n| 2005 | 199 |\n| 2006 | 207 |\n| 2007 | 215 |\n| 2008 | 228 |\n| 2009 | 245 |\nuse the data in the table to complete the statements. let x be the number of years since 1990. the year 2005 corresponds to an x - value of. the function that best models the data, with numerical values rounded to the nearest hundredth, is f(x)=x + 22.08. models have their limitations. for which year would this model not make sense to use?
Answer
Explanation:
Step1: Calculate x - value for 2005
To find the x - value (number of years since 1990), subtract 1990 from 2005. $x=2005 - 1990$ $x = 15$
Step2: Find the slope of the linear - function
We can use two points $(x_1,y_1)=(0,23)$ (corresponding to 1990) and $(x_2,y_2)=(15,199)$ (corresponding to 2005) to find the slope $m$ of the linear function $y = mx + b$. The slope formula is $m=\frac{y_2 - y_1}{x_2 - x_1}$. $m=\frac{199 - 23}{15-0}=\frac{176}{15}\approx11.73$
Step3: Determine when the model doesn't make sense
The model is based on data from 1990 - 2009. Extrapolating too far beyond this range would not make sense. For example, if we consider a year very far in the future, factors like changes in technology (e.g., electric cars becoming more prevalent), changes in gas prices due to geopolitical events, etc. would make the linear model inaccurate. A year like 2050 would be a year for which this model would not make sense.
Answer:
The year 2005 corresponds to an x - value of 15. The function is $f(x)=11.73x + 22.08$. The model would not make sense to use for 2050.