the bar graph shows the monthly cost of electricity for a household for one year. monthly electric bill…
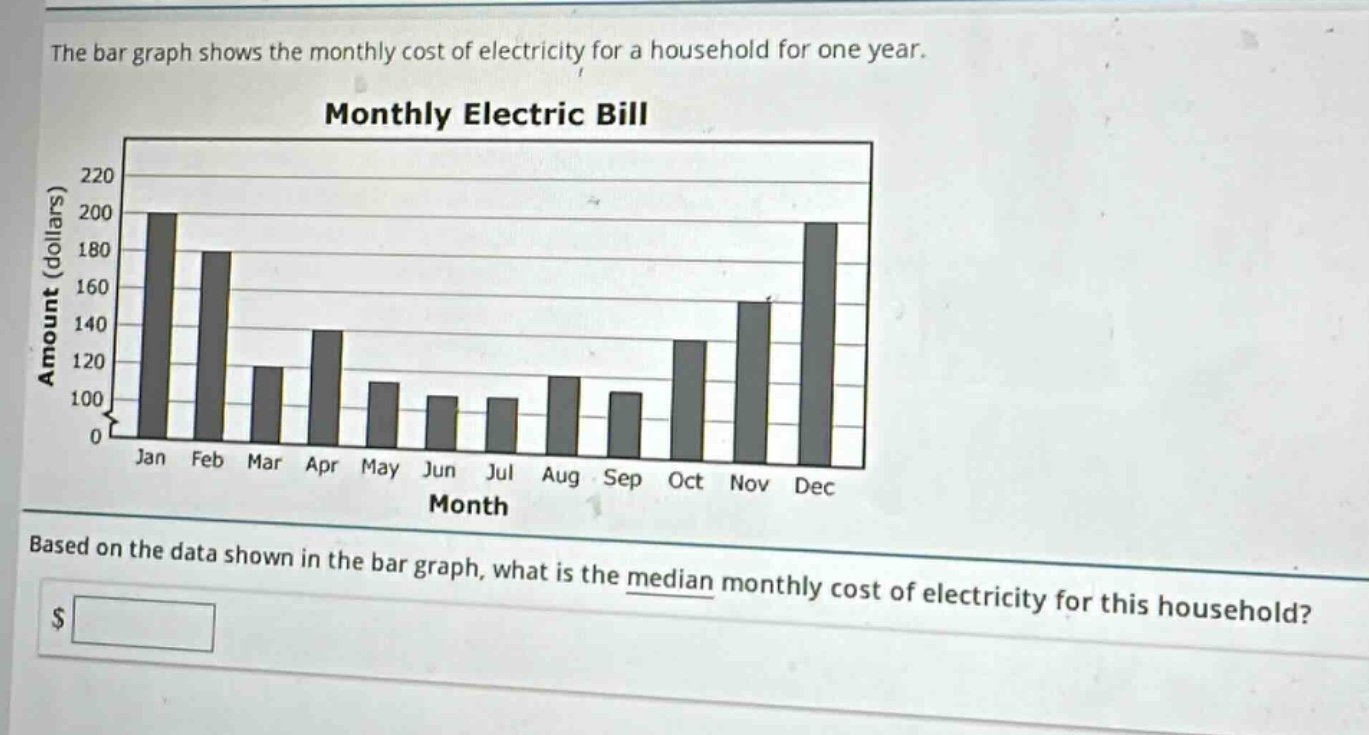
the bar graph shows the monthly cost of electricity for a household for one year. monthly electric bill based on the data shown in the bar graph, what is the median monthly cost of electricity for this household? $
Answer
Explanation:
Step1: List the data values
{200, 180, 120, 140, 110, 100, 100, 110, 100, 130, 150, 190}
Step2: Sort the data in ascending order
{100, 100, 100, 110, 110, 120, 130, 140, 150, 180, 190, 200}
Step3: Determine the position of the median
Since there are $n = 12$ data - points (an even number of data - points), the median is the average of the $\frac{n}{2}$th and $(\frac{n}{2}+1)$th ordered data - points. $\frac{n}{2}=\frac{12}{2}=6$ and $\frac{n}{2}+1 = 7$.
Step4: Calculate the median
Median=$\frac{120 + 130}{2}=\frac{250}{2}=125$
Answer:
125