based on the graph, what would be the slope for the line of best fit of the scatter plot?\na. 0\nb…
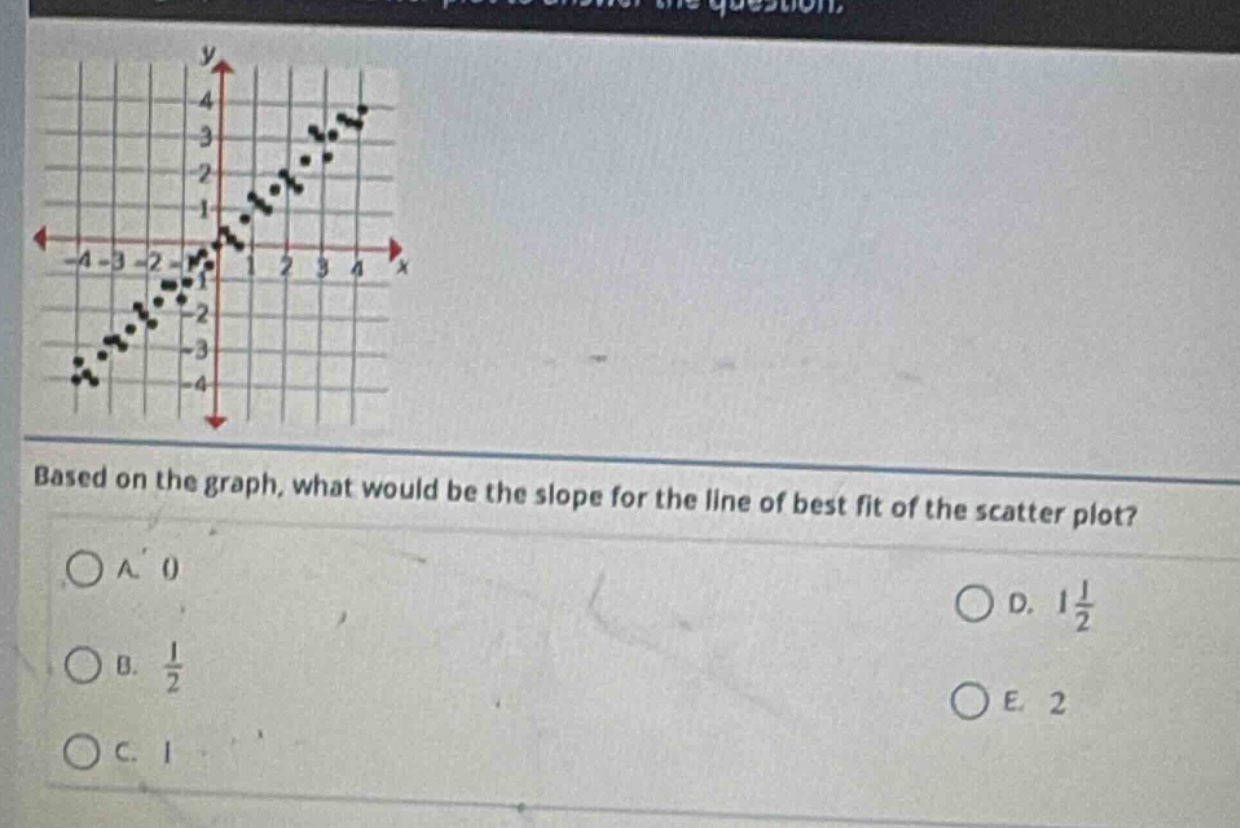
based on the graph, what would be the slope for the line of best fit of the scatter plot?\na. 0\nb. $\frac{1}{2}$\nc. 1\nd. $1\frac{1}{2}$\ne. 2
Answer
Explanation:
Step1: Recall slope formula
The slope formula is $m=\frac{y_2 - y_1}{x_2 - x_1}$. For a line of best - fit on a scatter - plot, we can estimate using two points that seem to represent the trend.
Step2: Select two points
We can choose two points that lie approximately on the line of best - fit. For example, we can choose $(0,0)$ and $(1,1)$.
Step3: Calculate slope
Substitute $x_1 = 0,y_1 = 0,x_2 = 1,y_2 = 1$ into the slope formula: $m=\frac{1 - 0}{1 - 0}=1$.
Answer:
C. 1